ADA is one of my favorite projects. Not just for its long term money making potential, but also for the way the project is trying to change the world. Do good while make money; can't go wrong with that! But, recently, everyone is getting too bullish on the price. Mind you, in the last year, ADA has seen a staggering 8000% gain, it is not unusual to see long form consolidation; even a short term down trend. While most people are looking at more upside; which I won't mind at all; I would like to take a quick look at what to expect on the opposite end. We will look at things on the weekly scale. Given, Kraken may not be the best exchange to see the full history, I am only interested in the current uptrend.
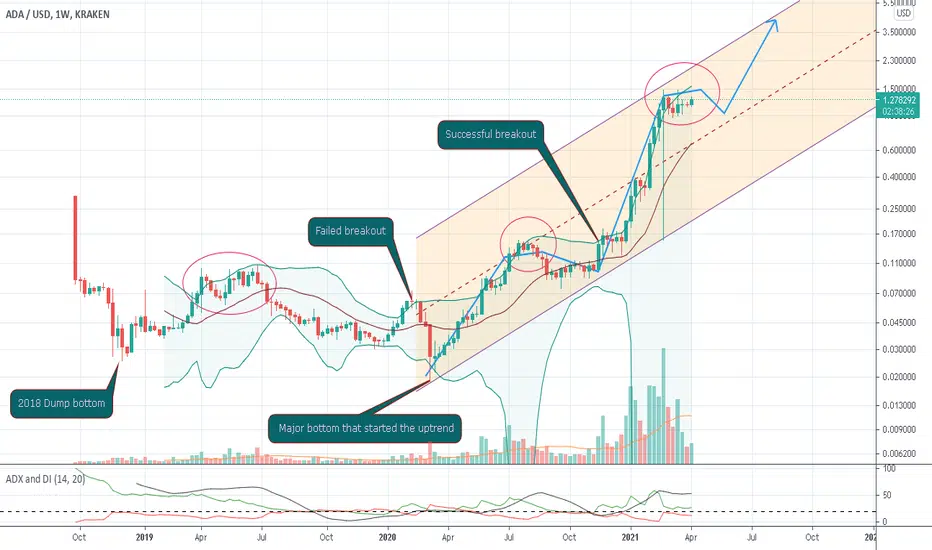
1. Every long consolidation on the top side of Bollinger bands has resulted in a drive to the bottom side of Bollinger bands until the Dec 2020 breakout. On the last successful breakout price started to stretch out Bollinger bands by having full candle bodies above the top line. Price is once again consolidating on the top end of the Bollinger bands. Question is, if we will see another round of breakout action or a cool down period or even a longer form consolidation like Oct/Nov of last year.
2. Price is on an upward channel since the major bottom of March 2020. The consolidation is happening on the top half of the channel. If we see a similar pattern from March - Dec 2020, at the bottom half of the channel, we could see a slight down to sideways for a bit longer to touch the half way mark and move up from there. Preferably longer price goes sideways more chance of major breakdown at this point. The channel midpoint will catch up with the price to provide the boost. That could also mean some patience until the end of this year.
3. The current ADX level has put the end of bull run in the last few iterations. Given there have only been a couple of iterations before, it is not for sure the bull run is over. My eyes are on the DI Plus line. As long as the DI plus stays above 25 level, with ADX on the current posture, we can still see some crazy gains before we see a top. But if DI Plus keeps falling, then chances are more time is needed to pick up the pace again. Might coincide with the second point of the analysis.
4. I think this market cycle will give us one full cycle, where as BTC is on its 4th and ETH is on its 2nd. There is still a chance we may see a parabolic blow off top to complete the cycle. It can also fall down from here all the way to the bottom of the channel and still maintain a higher low and higher high structure. So, it depends on how long it takes to start the final run. Longer things go sideways, greater the chance of reaching higher prices. We will find out when we find out.
Good luck out there!
Note
There might be a good buying opportunity coming up between .8 - .6 (not counting the fluke Kraken crash, which filled a forgotten limit order for me for a descent size).BTC will chart the market path, but I don't think we have seen the market cycle top yet. Patience and risk management is the key.Disclaimer
The information and publications are not meant to be, and do not constitute, financial, investment, trading, or other types of advice or recommendations supplied or endorsed by TradingView. Read more in the Terms of Use.
Disclaimer
The information and publications are not meant to be, and do not constitute, financial, investment, trading, or other types of advice or recommendations supplied or endorsed by TradingView. Read more in the Terms of Use.