Adobe: Multiple Bottom Signals Potential Upside
 ADBE has a clear history of respecting Multiple Bottoms and Tops. In other words, the stock tends to test the same price levels several times before moving decisively in the opposite direction. This repetitive behavior has been a reliable pattern in its price action.
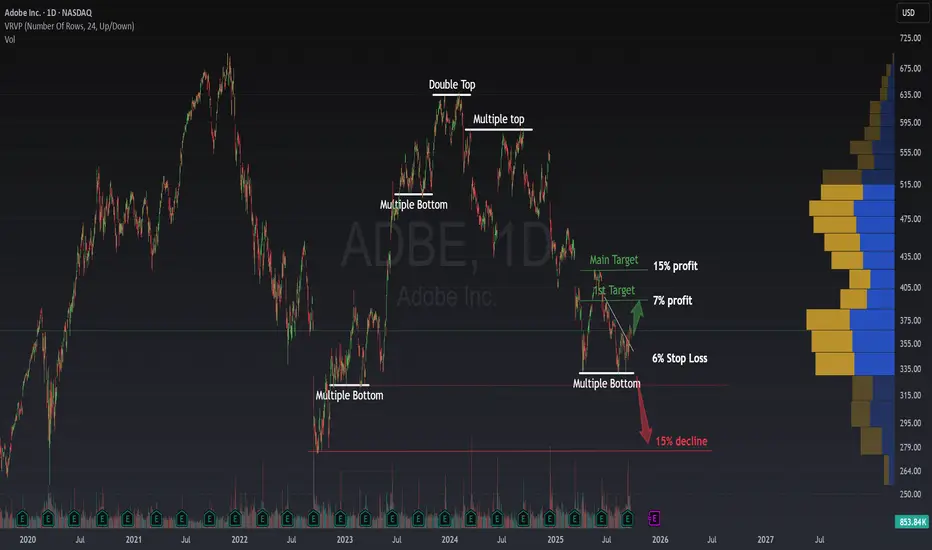
Currently, we are seeing the same setup, a Multiple Bottom (Triple Bottom) forming around the $330–$340 area. The market has bounced strongly from this zone and is even breaking minor downtrends, suggesting that bullish momentum is gaining strength.
📈 Short-term Upside Potential
If the breakout holds, the first target sits around $393, offering a 7% profit from current levels.
Looking further, based on Fibonacci retracements of the entire decline, the stock could reach as high as $420, which would represent around a 15% profit.
Personally, I prefer locking in profits earlier around the first target and then reallocating to other opportunities.
📉 Downside Risk
We must also remain cautious. If the price fails to hold this Multiple Bottom zone and breaks lower:
A decline could extend toward $277, representing a 15% downside.
The $322 level may still act as support, which is why I don’t like the short setup until this level is broken convincingly.
🟢 For more ideas, hit the rocket & follow.
⚡ Trading is not about luck or patience. Is about skills and knowledge. ⚡
I share my ideas, returns and knowledge here:
📚 👉 topchartpatterns.substack.com/subscribe 👈📚
🤝 Business contact: info@topchartpatterns.com
I share my ideas, returns and knowledge here:
📚 👉 topchartpatterns.substack.com/subscribe 👈📚
🤝 Business contact: info@topchartpatterns.com
Disclaimer
The information and publications are not meant to be, and do not constitute, financial, investment, trading, or other types of advice or recommendations supplied or endorsed by TradingView. Read more in the Terms of Use.