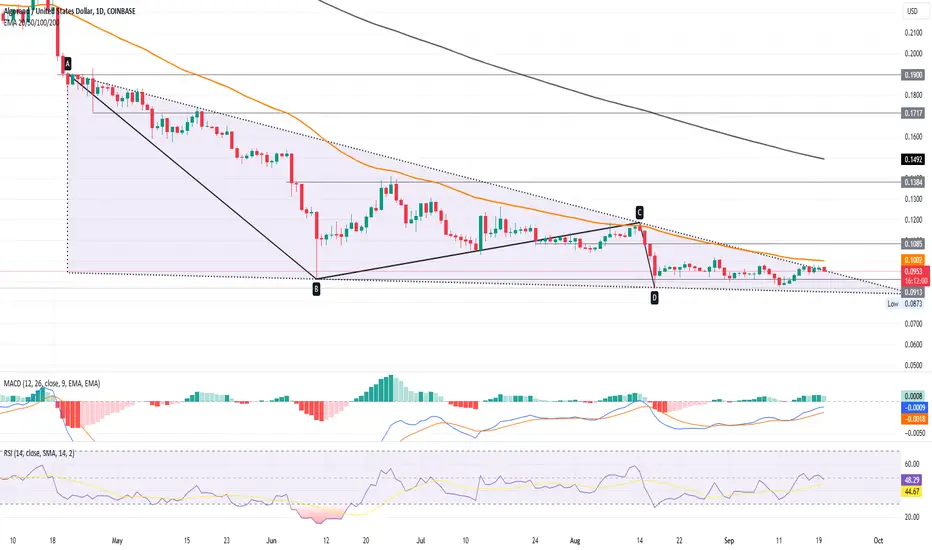
ALGO's daily charts indicate a triangle breakout pattern.
Algorand's current price struggles with the 50-day EMA barrier.
Potential to reach $0.10 if the 50-day EMA is surpassed.
ALGO has witnessed a 98% price reduction from its peak.
A descending triangle pattern is formed with a firm resistance trendline.
Uncertainty prevails due to sideways price movement.
RSI shows diminished bullish momentum.
MACD suggests a prospective bullish market.
Breaching $0.10 hinges on maintaining the upward momentum.
Disclaimer
The information and publications are not meant to be, and do not constitute, financial, investment, trading, or other types of advice or recommendations supplied or endorsed by TradingView. Read more in the Terms of Use.
Disclaimer
The information and publications are not meant to be, and do not constitute, financial, investment, trading, or other types of advice or recommendations supplied or endorsed by TradingView. Read more in the Terms of Use.