23-Jul
Price trend forecast timing analysis based on pretiming algorithm of Supply-Demand(S&D) strength flow.
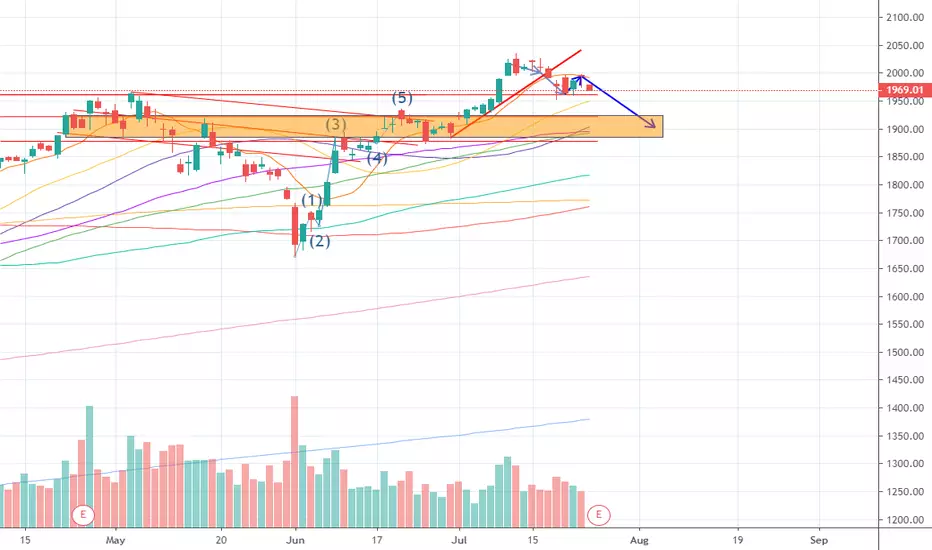
View forecasts shape of candlestick 10 days in the future: pretiming.com/search?q=AMZN
Investing position: In Falling section of high risk & low profit so far. But it would be in rising section tomorrow
Supply-Demand(S&D) strength Trend: About to begin a rebounding trend as a downward trend gradually gives way to slowdown in falling and rises fluctuations
Today's Supply-Demand(S&D) strength Flow: Supply-Demand(S&D) strength flow appropriate to the current trend.
Forecast D+1 Candlestick Color : GREEN Candlestick
%D+1 Range forecast: 0.7% (HIGH) ~ -0.7% (LOW), 0.1% (CLOSE)
%AVG in case of rising: 1.6% (HIGH) ~ -0.3% (LOW), 1.2% (CLOSE)
%AVG in case of falling: 0.3% (HIGH) ~ -1.9% (LOW), -1.5% (CLOSE)
Price trend forecast timing analysis based on pretiming algorithm of Supply-Demand(S&D) strength flow.
View forecasts shape of candlestick 10 days in the future: pretiming.com/search?q=AMZN
Investing position: In Falling section of high risk & low profit so far. But it would be in rising section tomorrow
Supply-Demand(S&D) strength Trend: About to begin a rebounding trend as a downward trend gradually gives way to slowdown in falling and rises fluctuations
Today's Supply-Demand(S&D) strength Flow: Supply-Demand(S&D) strength flow appropriate to the current trend.
Forecast D+1 Candlestick Color : GREEN Candlestick
%D+1 Range forecast: 0.7% (HIGH) ~ -0.7% (LOW), 0.1% (CLOSE)
%AVG in case of rising: 1.6% (HIGH) ~ -0.3% (LOW), 1.2% (CLOSE)
%AVG in case of falling: 0.3% (HIGH) ~ -1.9% (LOW), -1.5% (CLOSE)
Disclaimer
The information and publications are not meant to be, and do not constitute, financial, investment, trading, or other types of advice or recommendations supplied or endorsed by TradingView. Read more in the Terms of Use.
Disclaimer
The information and publications are not meant to be, and do not constitute, financial, investment, trading, or other types of advice or recommendations supplied or endorsed by TradingView. Read more in the Terms of Use.