Will Buyers Step In or Is a Bigger Drop Coming?
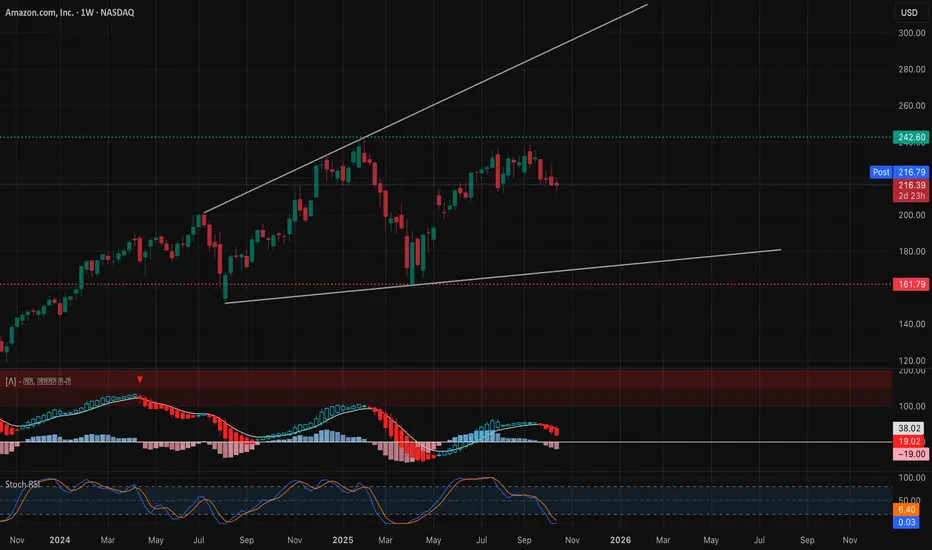
🧭 Weekly Chart – Macro Market Structure
Amazon’s weekly chart reveals a consolidation at the top of a long-term ascending channel, with clear exhaustion signs showing after months of strong accumulation. The structure printed a CHoCH (Change of Character) below the $242 resistance zone, signaling that sellers are regaining control short-term.
Price is now hovering around $197–$216, right above the key structural support that has held since mid-2024. The BOS (Break of Structure) at $197.9 last quarter remains unchallenged, so buyers still have a chance to defend this level.
However, the weekly MACD is flattening after a bearish crossover, and Stoch RSI at 76.9 shows the overbought cooling phase isn’t done yet.
* If $216 fails, expect a deeper retracement to $197 or even $182–$185, aligning with the lower trendline of the macro channel.
* If $220 reclaims, we could see a rebound toward $238–$242, the major supply zone where previous liquidity was swept.
Weekly Summary: Structure still bullish long-term, but short-term correction risk remains high. Bulls must defend $197–$211 zone to prevent a deeper downtrend shift.
⚙️ Daily Chart – Mid-Term Battle Zone

The daily chart paints a more tactical story: AMZN has just confirmed another BOS down while bouncing along the ascending trendline from April. A repeated liquidity grab near $211–$212 has kept price inside this structure.
The 9 EMA has crossed below the 21 EMA, confirming short-term bearish momentum. But the MACD is beginning to flatten, hinting that sellers may be losing steam.
* Bullish Scenario: If AMZN reclaims $218–$220, it opens room for recovery toward $226, then $232 (previous fair value gap and GEX wall zone).
* Bearish Scenario: A daily close below $211.50 would invalidate the local support, triggering continuation toward $197.50 and eventually $182 if the momentum snowballs.
Daily Bias: Neutral-to-bearish until buyers reclaim $220. Still range-bound, but the risk/reward favors patience until structure confirmation.
⏱ 1-Hour Chart – Short-Term Trading Plan

The 1-hour chart shows multiple CHoCH and BOS rotations, forming a clear descending range between $210–$228. The structure is still bearish overall, but the most recent BOS up with bullish divergence on MACD and Stoch RSI indicates potential for a short-term bounce.
Volume profile shows absorption below $212 — that’s where smart money likely reloaded positions.
* Trading Plan:
* Bullish setup: Above $217.5, target $222.5 → $228, stop below $214.5.
* Bearish setup: Below $211.5, short toward $205, stop above $215.
If $217.5 breaks with volume, intraday momentum can accelerate fast toward $222 where heavy GEX call wall aligns.
Short-Term Bias: Accumulation phase in progress. Expect choppy rebounds until one side breaks structure decisively.
💥 Options GEX & Institutional Positioning

From the Options GEX [PRO] snapshot:
* Highest positive GEX (Call Wall): $222 → Key resistance / potential short-term magnet if breakout happens.
* 2nd Call Wall: $227.5 → strong gamma resistance, aligns with upside fade zone.
* Major PUT Support: $210 (–56.9% GEX) → strong liquidity and protection level.
* IVR 46.4 / IVx 44.4 → elevated volatility, great for traders who prefer spreads over straight directional bets.
Gamma Flow Interpretation: Market makers are heavily neutralized between $215–$220. Above $220, delta hedging could force a rapid squeeze. Below $211, negative gamma expands volatility and drives deeper flushes.
🎯 Option Strategy Suggestions
1️⃣ Bullish Play:
* Buy $220C / Sell $230C (Oct 25 expiry) → captures breakout to $230, limited risk and defined reward.
* For fast momentum: Buy 0DTE/2DTE $217.5 Calls once $218 breaks with strong volume.
2️⃣ Bearish Hedge:
* If $211 breaks, Buy $210P / Sell $200P (Oct 18 expiry) — clean structure for downside continuation.
3️⃣ Neutral Income Play:
* Expecting consolidation? Sell Iron Condor: $230C/$235C + $205P/$200P — capitalize on theta decay while AMZN stays trapped.
💬 Final Thoughts
AMZN is at a critical inflection point — it’s neither fully broken down nor ready to rally yet. This $211–$218 pocket is the battlefield. Bulls reclaiming $220 flips the narrative back to bullish continuation. Bears breaking $211 unlocks a path to $197.
My TA continues to show high win-rate precision, and traders can verify from past history that levels often react exactly as mapped. If you want me to break down any stock that I don’t regularly post, DM me — I’ll be happy to TA it for you.
This analysis is for educational purposes only and does not constitute financial advice. Always do your own research and manage your risk before trading.
🧭 Weekly Chart – Macro Market Structure
Amazon’s weekly chart reveals a consolidation at the top of a long-term ascending channel, with clear exhaustion signs showing after months of strong accumulation. The structure printed a CHoCH (Change of Character) below the $242 resistance zone, signaling that sellers are regaining control short-term.
Price is now hovering around $197–$216, right above the key structural support that has held since mid-2024. The BOS (Break of Structure) at $197.9 last quarter remains unchallenged, so buyers still have a chance to defend this level.
However, the weekly MACD is flattening after a bearish crossover, and Stoch RSI at 76.9 shows the overbought cooling phase isn’t done yet.
* If $216 fails, expect a deeper retracement to $197 or even $182–$185, aligning with the lower trendline of the macro channel.
* If $220 reclaims, we could see a rebound toward $238–$242, the major supply zone where previous liquidity was swept.
Weekly Summary: Structure still bullish long-term, but short-term correction risk remains high. Bulls must defend $197–$211 zone to prevent a deeper downtrend shift.
⚙️ Daily Chart – Mid-Term Battle Zone
The daily chart paints a more tactical story: AMZN has just confirmed another BOS down while bouncing along the ascending trendline from April. A repeated liquidity grab near $211–$212 has kept price inside this structure.
The 9 EMA has crossed below the 21 EMA, confirming short-term bearish momentum. But the MACD is beginning to flatten, hinting that sellers may be losing steam.
* Bullish Scenario: If AMZN reclaims $218–$220, it opens room for recovery toward $226, then $232 (previous fair value gap and GEX wall zone).
* Bearish Scenario: A daily close below $211.50 would invalidate the local support, triggering continuation toward $197.50 and eventually $182 if the momentum snowballs.
Daily Bias: Neutral-to-bearish until buyers reclaim $220. Still range-bound, but the risk/reward favors patience until structure confirmation.
⏱ 1-Hour Chart – Short-Term Trading Plan
The 1-hour chart shows multiple CHoCH and BOS rotations, forming a clear descending range between $210–$228. The structure is still bearish overall, but the most recent BOS up with bullish divergence on MACD and Stoch RSI indicates potential for a short-term bounce.
Volume profile shows absorption below $212 — that’s where smart money likely reloaded positions.
* Trading Plan:
* Bullish setup: Above $217.5, target $222.5 → $228, stop below $214.5.
* Bearish setup: Below $211.5, short toward $205, stop above $215.
If $217.5 breaks with volume, intraday momentum can accelerate fast toward $222 where heavy GEX call wall aligns.
Short-Term Bias: Accumulation phase in progress. Expect choppy rebounds until one side breaks structure decisively.
💥 Options GEX & Institutional Positioning
From the Options GEX [PRO] snapshot:
* Highest positive GEX (Call Wall): $222 → Key resistance / potential short-term magnet if breakout happens.
* 2nd Call Wall: $227.5 → strong gamma resistance, aligns with upside fade zone.
* Major PUT Support: $210 (–56.9% GEX) → strong liquidity and protection level.
* IVR 46.4 / IVx 44.4 → elevated volatility, great for traders who prefer spreads over straight directional bets.
Gamma Flow Interpretation: Market makers are heavily neutralized between $215–$220. Above $220, delta hedging could force a rapid squeeze. Below $211, negative gamma expands volatility and drives deeper flushes.
🎯 Option Strategy Suggestions
1️⃣ Bullish Play:
* Buy $220C / Sell $230C (Oct 25 expiry) → captures breakout to $230, limited risk and defined reward.
* For fast momentum: Buy 0DTE/2DTE $217.5 Calls once $218 breaks with strong volume.
2️⃣ Bearish Hedge:
* If $211 breaks, Buy $210P / Sell $200P (Oct 18 expiry) — clean structure for downside continuation.
3️⃣ Neutral Income Play:
* Expecting consolidation? Sell Iron Condor: $230C/$235C + $205P/$200P — capitalize on theta decay while AMZN stays trapped.
💬 Final Thoughts
AMZN is at a critical inflection point — it’s neither fully broken down nor ready to rally yet. This $211–$218 pocket is the battlefield. Bulls reclaiming $220 flips the narrative back to bullish continuation. Bears breaking $211 unlocks a path to $197.
My TA continues to show high win-rate precision, and traders can verify from past history that levels often react exactly as mapped. If you want me to break down any stock that I don’t regularly post, DM me — I’ll be happy to TA it for you.
This analysis is for educational purposes only and does not constitute financial advice. Always do your own research and manage your risk before trading.
Disclaimer
The information and publications are not meant to be, and do not constitute, financial, investment, trading, or other types of advice or recommendations supplied or endorsed by TradingView. Read more in the Terms of Use.
Disclaimer
The information and publications are not meant to be, and do not constitute, financial, investment, trading, or other types of advice or recommendations supplied or endorsed by TradingView. Read more in the Terms of Use.