Disclaimer: This chart and analysis are not meant to be, and do not constitute, financial, investment, trading, or other types of advice or recommendations. Do your own due diligence before trading or investing in any stock exchanges, Indices, Stocks, Forex, Crypto etc.
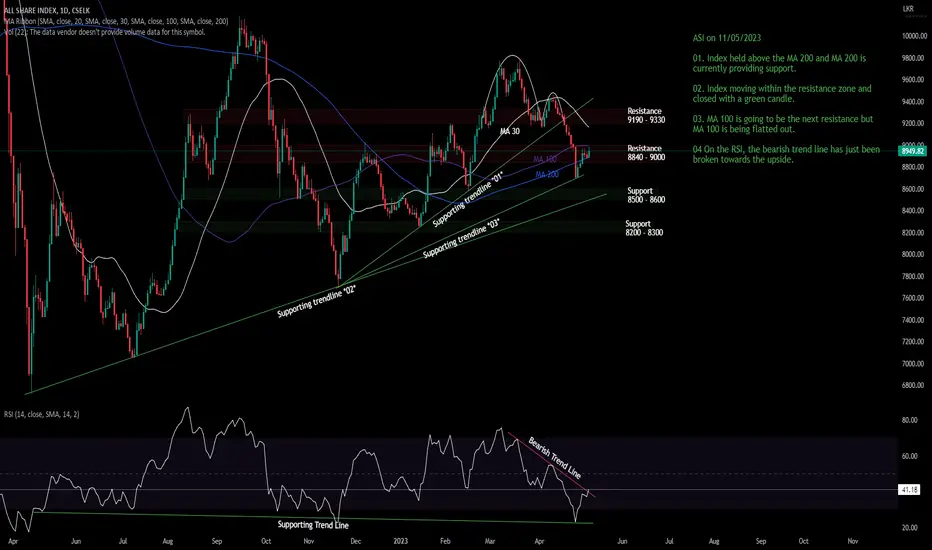
ASI on 11/05/2023
01. Index held above the MA 200 and MA 200 is currently providing support.
02. Index moving within the resistance zone and closed with a green candle.
03. MA 100 is going to be the next resistance but MA 100 is being flatted out.
04 On the RSI, the bearish trend line has just been broken towards the upside.
Disclaimer
The information and publications are not meant to be, and do not constitute, financial, investment, trading, or other types of advice or recommendations supplied or endorsed by TradingView. Read more in the Terms of Use.
Disclaimer
The information and publications are not meant to be, and do not constitute, financial, investment, trading, or other types of advice or recommendations supplied or endorsed by TradingView. Read more in the Terms of Use.