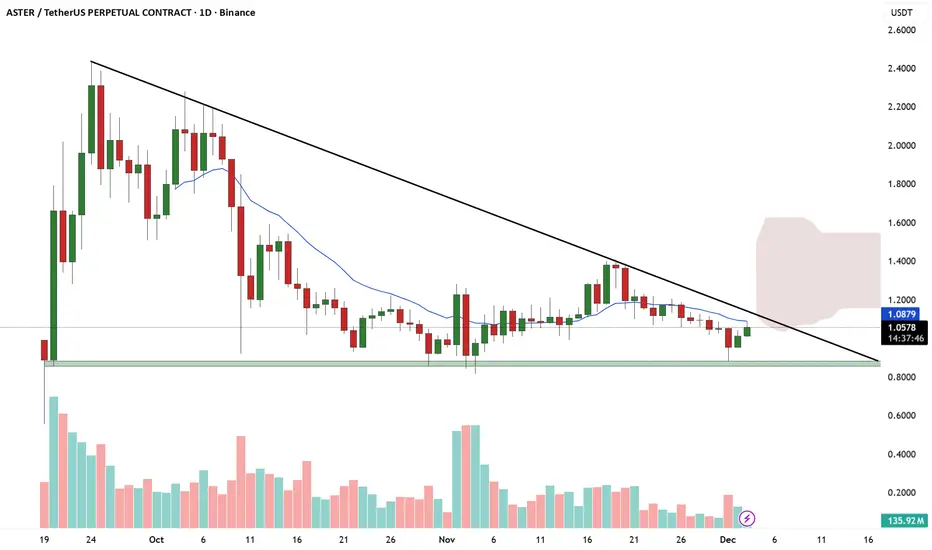
On the 1-day chart, **ASTER/USDT** is moving within a clear descending triangle structure, showing consistent lower highs while holding a strong horizontal support around the **$0.97–$1.00** zone. Price has recently bounced slightly from this demand level but remains capped below the descending trendline resistance, which has been respected multiple times since October. The candles are showing mild recovery momentum, yet the 9-EMA is still acting as dynamic resistance, keeping the overall bias mildly bearish until a decisive breakout occurs.
Volume is relatively stable but lacks the strong uptick usually seen before a breakout, suggesting that buyers are cautious. If the price sustains above the EMA and breaks cleanly above the descending trendline near **$1.10–$1.12**, it could trigger a bullish reversal toward **$1.25–$1.40**. However, a daily close below **$0.97** would likely lead to further downside continuation toward **$0.88–$0.85**. Overall, the pair is at a key compression point — consolidation near support inside a falling wedge — and the next breakout will define the medium-term trend direction.
Volume is relatively stable but lacks the strong uptick usually seen before a breakout, suggesting that buyers are cautious. If the price sustains above the EMA and breaks cleanly above the descending trendline near **$1.10–$1.12**, it could trigger a bullish reversal toward **$1.25–$1.40**. However, a daily close below **$0.97** would likely lead to further downside continuation toward **$0.88–$0.85**. Overall, the pair is at a key compression point — consolidation near support inside a falling wedge — and the next breakout will define the medium-term trend direction.
SpyOnGems (Mayank) | Technical Analysis & Education | Telegram: t.me/spyongems
Disclaimer
The information and publications are not meant to be, and do not constitute, financial, investment, trading, or other types of advice or recommendations supplied or endorsed by TradingView. Read more in the Terms of Use.