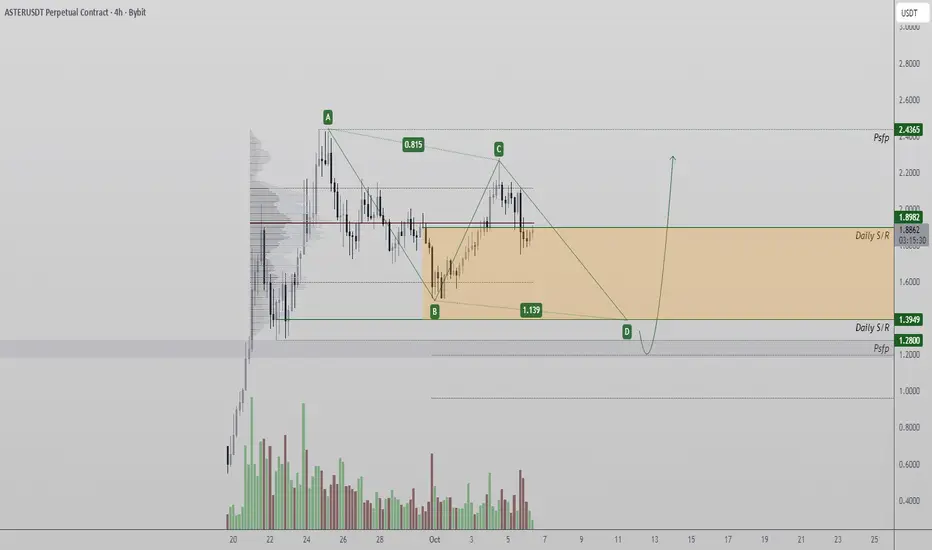
The ASTER price has undergone a sharp weekend correction, losing the $1.90 technical level that previously acted as both support and resistance. This breakdown places the asset within a short-term corrective phase, which could unfold as an ABCD pattern — a typical structure during mid-trend retracements.
Key Technical Points:
- Price closed below $1.90, confirming a short-term correction.
- 0.618 Fibonacci retracement aligns with the key breakdown level.
- The correction may form an ABCD pattern before resuming its bullish rotation.
ASTER’s drop below $1.90 confirms the market’s transition from impulsive expansion to corrective mode. The 0.618 Fibonacci level reinforces the importance of this zone, as it often marks areas where pullbacks develop mid-trend.
From a liquidity standpoint, lower levels remain untapped. This implies that price could move further down to sweep resting liquidity before forming a reversal structure. A swing-failure pattern (SFP) at these lows would provide the ideal confirmation for a bullish rotation back toward the range highs.
The correction appears technically healthy within the broader bullish context. ABCD-type retracements often serve to reset momentum indicators and remove late buyers before continuation.
What to Expect in the Coming Price Action:
As long as ASTER trades below $1.90, the corrective structure remains valid. A successful liquidity sweep followed by a close above $1.90 would signal a potential reversal and resumption toward higher targets.
Join the Free Trading Group
Telegram: t.me/freetradingden 🔥
Claim $1000 Deposit Bonus 🎁
Trade with perks & support the community!
partner.blofin.com/d/TheAlchemist
Stay sharp, trade smart.
— Team The Alchemist ⚔️
Telegram: t.me/freetradingden 🔥
Claim $1000 Deposit Bonus 🎁
Trade with perks & support the community!
partner.blofin.com/d/TheAlchemist
Stay sharp, trade smart.
— Team The Alchemist ⚔️
Disclaimer
The information and publications are not meant to be, and do not constitute, financial, investment, trading, or other types of advice or recommendations supplied or endorsed by TradingView. Read more in the Terms of Use.