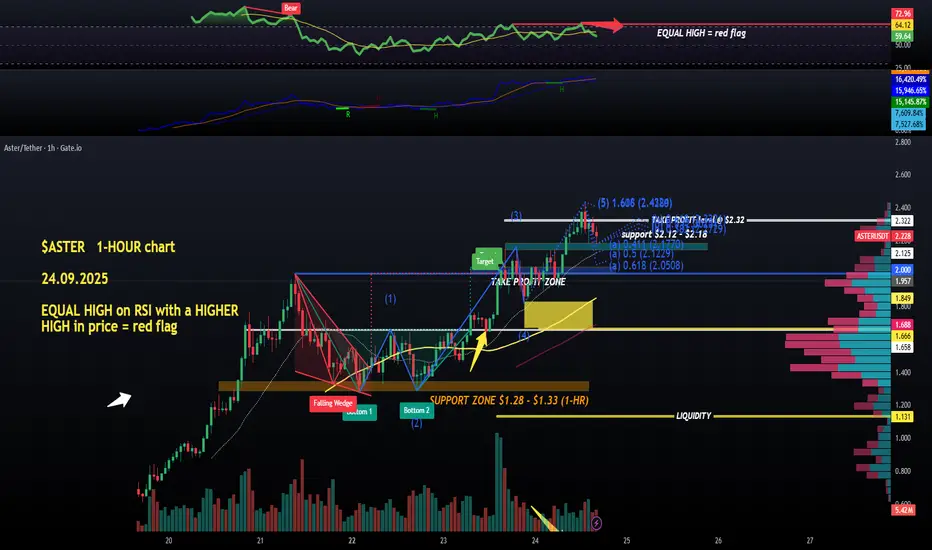
$ASTER did hit my full take profit level ($2.32) on the long opened at $1.71, it even extended to its #ATH at $2.43, so the leverage is gone and that was a perfect BREAKOUT trade.
What next, apart from a strong #HODL on my spot position ($1.4 average entry, not great, not bad)?
On the HOURLY chart it looks like that was WAVE 5 (the last impulsive wave up in Elliot's Wave Theory) reaching ATH but we got some form of a BEAR RSI divergence due to only an equal high while the price action clearly made a solid leg up.
So, i will be looking to catch some long entries on a correction, obviously, my first level to watch would be the support zone betwen $2 and $2.06.
Will need to see better volumes today and a better looking RSI profile first. OBV hidden bullish divergence recently.
So, waiting on a correction, basically and monitoring the 15-MIN chart (next post) 💙👽
Disclaimer
The information and publications are not meant to be, and do not constitute, financial, investment, trading, or other types of advice or recommendations supplied or endorsed by TradingView. Read more in the Terms of Use.
Disclaimer
The information and publications are not meant to be, and do not constitute, financial, investment, trading, or other types of advice or recommendations supplied or endorsed by TradingView. Read more in the Terms of Use.