Hi everyone,
Yesterday, I released a post where I was discussing how
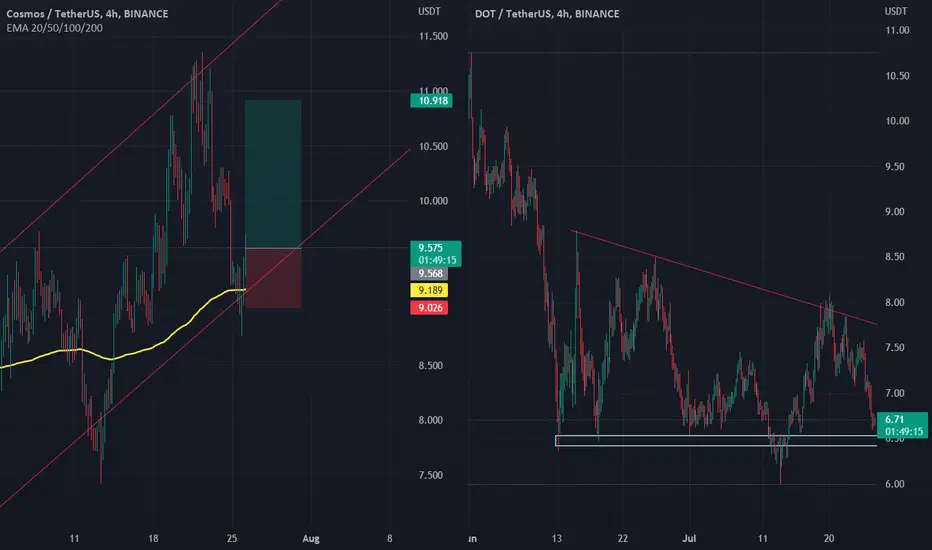
 DOTUSDT lost its micro support and broke the pattern it was forming to the downside. That breakout triggered a lot of stops below the flag.

However, it is regaining its momentum by slowly decreasing the size of its red candles. We can also confirm that it found its new support by drawing support lines onDOTUSDT and  ATOMUSDT where ATOM has found a strong support in confluence with the 200 ema.
HOWEVER, In this chart, ATOM is forming a Head and Shoulders and DOT is forming a descending triangle on the higher timeframe, which is bearish for both currencies.

So, ATOM might be retesting a resistance area before quitting its uptrend channel.
In conclusion, the best action to do is to not close positions already taken but to reduce them.
Hope you enjoyed today's analysis😊.
Yesterday, I released a post where I was discussing how
However, it is regaining its momentum by slowly decreasing the size of its red candles. We can also confirm that it found its new support by drawing support lines on
HOWEVER, In this chart, ATOM is forming a Head and Shoulders and DOT is forming a descending triangle on the higher timeframe, which is bearish for both currencies.
So, ATOM might be retesting a resistance area before quitting its uptrend channel.
In conclusion, the best action to do is to not close positions already taken but to reduce them.
Hope you enjoyed today's analysis😊.
Related publications
Disclaimer
The information and publications are not meant to be, and do not constitute, financial, investment, trading, or other types of advice or recommendations supplied or endorsed by TradingView. Read more in the Terms of Use.
Related publications
Disclaimer
The information and publications are not meant to be, and do not constitute, financial, investment, trading, or other types of advice or recommendations supplied or endorsed by TradingView. Read more in the Terms of Use.