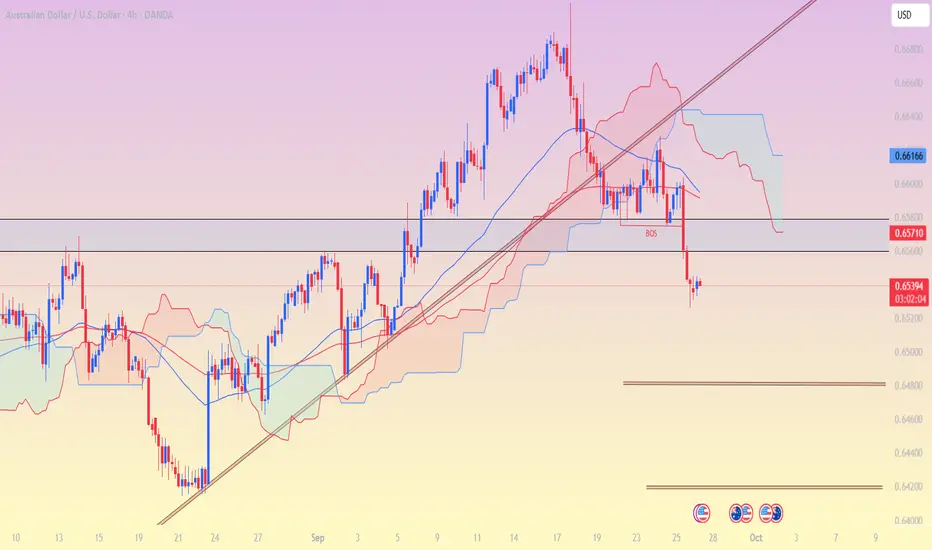
AUD/USD 4H chart with Ichimoku, structure lines, and a BOS (Break of Structure) marked. Based on the chart:
Price has broken below the 0.6570 support zone (BOS level).
It’s now consolidating slightly under 0.6550 after a strong bearish candle.
The Ichimoku cloud is bearish, and price is below the Kumo, Tenkan, and Kijun, which confirms downward momentum.
Next major demand zone / support (marked on my chart) looks to be around 0.6480 – 0.6460.
If that breaks, a deeper target sits near 0.6420 – 0.6400.
📌 So, possible short-term targets:
1. 0.6480 – 0.6460
2. 0.6420 – 0.6400 (extended target if bearish pressure continues)
⚠ Keep in mind: If price reclaims 0.6570 and closes above, that would invalidate the bearish setup and suggest a possible pullback.
Trade active
trade active📲 Join telegram channel free ..
t.me/RSI_Trading_Point4
Forex, Gold & Crypto Signals with detailed analysis & get consistent results..
t.me/XauusdGlobalSignal17
Gold Signal's with proper TP & SL for high profit opportunities..
t.me/RSI_Trading_Point4
Forex, Gold & Crypto Signals with detailed analysis & get consistent results..
t.me/XauusdGlobalSignal17
Gold Signal's with proper TP & SL for high profit opportunities..
Related publications
Disclaimer
The information and publications are not meant to be, and do not constitute, financial, investment, trading, or other types of advice or recommendations supplied or endorsed by TradingView. Read more in the Terms of Use.
📲 Join telegram channel free ..
t.me/RSI_Trading_Point4
Forex, Gold & Crypto Signals with detailed analysis & get consistent results..
t.me/XauusdGlobalSignal17
Gold Signal's with proper TP & SL for high profit opportunities..
t.me/RSI_Trading_Point4
Forex, Gold & Crypto Signals with detailed analysis & get consistent results..
t.me/XauusdGlobalSignal17
Gold Signal's with proper TP & SL for high profit opportunities..
Related publications
Disclaimer
The information and publications are not meant to be, and do not constitute, financial, investment, trading, or other types of advice or recommendations supplied or endorsed by TradingView. Read more in the Terms of Use.