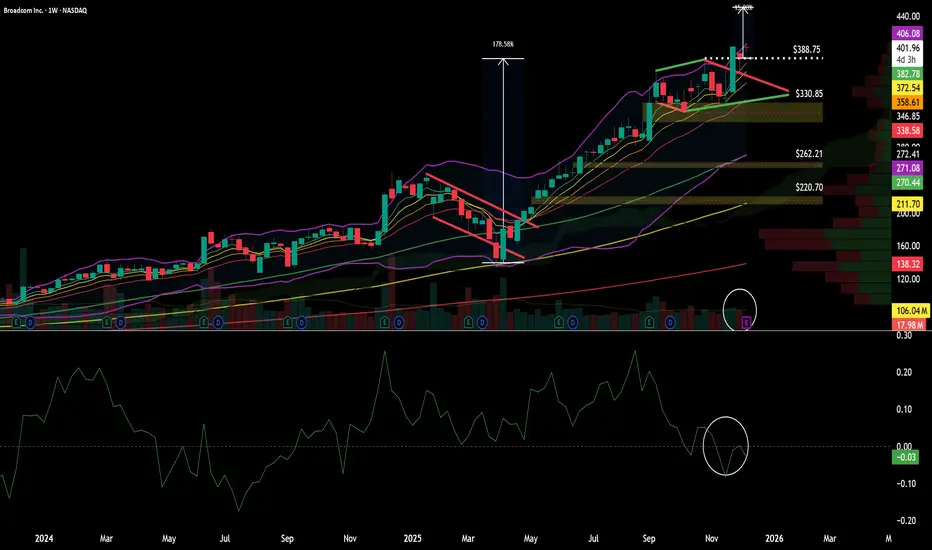
Broadcom continues to trade as one of the strongest structural leaders inside this secular bull market. From the “Liberation Day” inflection point, price is now up roughly +178%, with trend structure remaining firmly intact across the higher timeframes. Throughout this entire advance,  AVGO has displayed classic institutional trend behavior — persistent EMA support, shallow pullbacks, and clean continuation structures.
From a moving average perspective, this rally has been textbook. During the entire impulse phase, price has mostly remained compressed within the 5 and 8-day EMAs, rarely giving up the 13-day EMA, which confirms strong momentum preservation. This type of behavior is typical of sustained institutional accumulation phases rather than late-stage retail blow-offs.
Earlier in the year, price briefly lost the lower boundary of its prior flag structure in April. That breakdown proved to be a bear trap, with price finding clean support at the 100-day MA before resuming trend higher. That reaction confirmed the broader bull structure was never damaged — it was merely being reset.
Fair Value Gaps & Internal Market Structure
This advance has also left behind multiple Fair Value Gaps (FVGs) during its strongest expansion phases, reinforcing the strength and imbalance created by aggressive buying. Two of these FVGs remain unfilled, which keeps the broader trend biased higher, but also reminds us where price could naturally gravitate if a deeper corrective phase eventually develops.
Pennant Formation & Breakout Characteristics
Since early September,AVGO entered a period of controlled digestion, carving out a 12-week bull pennant. This structure formed after an impulsive upside leg and reflects healthy consolidation rather than distribution.
Two weeks ago, price broke out of this pennant with a Marubozu candle, signalling decisive institutional participation and thrust to fresh all-time highs. The candle that followed performed an important technical validation — it retested the top of the breakout structure and successfully closed above the prior ATH, confirming acceptance at higher prices.
Structurally, this is exactly what you want to see after a continuation breakout: expansion → retest → acceptance.
Momentum & Volume Warning Signals
Despite the clean structural breakout, short-term momentum is now showing early signs of fatigue. The Chaikin Money Flow (CMF) has slipped back below the zero line, and breakout volume failed to expand meaningfully compared with earlier impulse phases. This does not invalidate the bull trend, but it does temper near-term expectations and suggests price may need additional digestion before another strong leg higher can unfold.
This sets up a classic scenario where price can remain elevated while momentum rebuilds, rather than an immediate acceleration higher.
Measured Move Analysis & Targets
A traditional 1:1 projection of the prior flagpole would imply a ~65% upside extension, targeting the $637–$638 zone. However, given the current momentum profile and volume behavior, that projection appears structurally valid but tactically premature in the short term.
A more realistic and technically grounded near-term objective comes from a 1:1 measured move of the bull pennant itself, which projects to approximately $450. This target aligns better with the current rate of expansion and avoids overstretch risk.
Key Technical Zones
Immediate structure remains supported above the prior breakout region near $388–390, with deeper structural supports stepping in around:
$330–332 (trend base / structure)
$262 (prior FVG / higher-timeframe equilibrium)
$220 (major weekly support / regime-level demand)
As long as price holds above these higher supports on a weekly closing basis, the broader secular uptrend remains fully intact.
Fundamental Backdrop
Broadcom continues to reinforce its technical strength with exceptional earnings consistency. The company has not missed an earnings print since 2020, which provides a powerful fundamental tailwind beneath this multi-year technical structure.
Summary
AVGO remains one of the cleanest examples of a secular bull trend in motion — supported by EMA compression, recurring continuation structures, clean pennant behavior, and strong earnings consistency. While momentum has cooled slightly following the most recent breakout, the higher-timeframe structure remains firmly bullish.
Near-term, the $450 pennant projection serves as the most realistic upside objective, while the larger $630+ flagpole projection remains a longer-cycle potential if momentum fully rebuilds.
From a moving average perspective, this rally has been textbook. During the entire impulse phase, price has mostly remained compressed within the 5 and 8-day EMAs, rarely giving up the 13-day EMA, which confirms strong momentum preservation. This type of behavior is typical of sustained institutional accumulation phases rather than late-stage retail blow-offs.
Earlier in the year, price briefly lost the lower boundary of its prior flag structure in April. That breakdown proved to be a bear trap, with price finding clean support at the 100-day MA before resuming trend higher. That reaction confirmed the broader bull structure was never damaged — it was merely being reset.
Fair Value Gaps & Internal Market Structure
This advance has also left behind multiple Fair Value Gaps (FVGs) during its strongest expansion phases, reinforcing the strength and imbalance created by aggressive buying. Two of these FVGs remain unfilled, which keeps the broader trend biased higher, but also reminds us where price could naturally gravitate if a deeper corrective phase eventually develops.
Pennant Formation & Breakout Characteristics
Since early September,
Two weeks ago, price broke out of this pennant with a Marubozu candle, signalling decisive institutional participation and thrust to fresh all-time highs. The candle that followed performed an important technical validation — it retested the top of the breakout structure and successfully closed above the prior ATH, confirming acceptance at higher prices.
Structurally, this is exactly what you want to see after a continuation breakout: expansion → retest → acceptance.
Momentum & Volume Warning Signals
Despite the clean structural breakout, short-term momentum is now showing early signs of fatigue. The Chaikin Money Flow (CMF) has slipped back below the zero line, and breakout volume failed to expand meaningfully compared with earlier impulse phases. This does not invalidate the bull trend, but it does temper near-term expectations and suggests price may need additional digestion before another strong leg higher can unfold.
This sets up a classic scenario where price can remain elevated while momentum rebuilds, rather than an immediate acceleration higher.
Measured Move Analysis & Targets
A traditional 1:1 projection of the prior flagpole would imply a ~65% upside extension, targeting the $637–$638 zone. However, given the current momentum profile and volume behavior, that projection appears structurally valid but tactically premature in the short term.
A more realistic and technically grounded near-term objective comes from a 1:1 measured move of the bull pennant itself, which projects to approximately $450. This target aligns better with the current rate of expansion and avoids overstretch risk.
Key Technical Zones
Immediate structure remains supported above the prior breakout region near $388–390, with deeper structural supports stepping in around:
$330–332 (trend base / structure)
$262 (prior FVG / higher-timeframe equilibrium)
$220 (major weekly support / regime-level demand)
As long as price holds above these higher supports on a weekly closing basis, the broader secular uptrend remains fully intact.
Fundamental Backdrop
Broadcom continues to reinforce its technical strength with exceptional earnings consistency. The company has not missed an earnings print since 2020, which provides a powerful fundamental tailwind beneath this multi-year technical structure.
Summary
Near-term, the $450 pennant projection serves as the most realistic upside objective, while the larger $630+ flagpole projection remains a longer-cycle potential if momentum fully rebuilds.
Disclaimer
The information and publications are not meant to be, and do not constitute, financial, investment, trading, or other types of advice or recommendations supplied or endorsed by TradingView. Read more in the Terms of Use.
Disclaimer
The information and publications are not meant to be, and do not constitute, financial, investment, trading, or other types of advice or recommendations supplied or endorsed by TradingView. Read more in the Terms of Use.