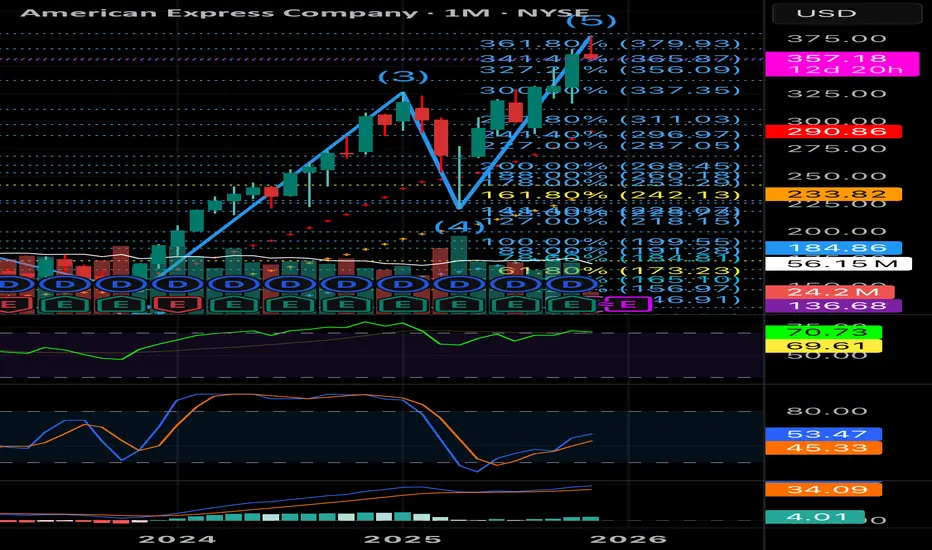
Seeing similar trend patterns in many stocks and AXP is one of them. Check out the monthly and weekly charts and it’s obvious that the trend has lost it’s momentum. Negative divergences appeared on both time frames. And since the trend has started in autumn 2022, it has made more than a 100% increase in 3 years. On average, more than 33% each year. You think it will keep on going? Elliott and rsi show that a downtrend is on the horizon.
Disclaimer
The information and publications are not meant to be, and do not constitute, financial, investment, trading, or other types of advice or recommendations supplied or endorsed by TradingView. Read more in the Terms of Use.
Disclaimer
The information and publications are not meant to be, and do not constitute, financial, investment, trading, or other types of advice or recommendations supplied or endorsed by TradingView. Read more in the Terms of Use.