📈 Bank Nifty – Daily Timeframe Analysis
⸻⸻⸻⸻⸻⸻⸻⸻⸻⸻
📊 Key Observations
⸻⸻⸻⸻⸻⸻⸻⸻⸻⸻⸻
✅ Summary
⸻⸻⸻⸻⸻⸻⸻⸻⸻⸻⸻
⚠️ Disclaimer:
📘 For educational purposes only.
🙅 Not SEBI registered.
❌ Not a buy/sell recommendation.
🧠 Purely a learning resource.
📊 Not Financial Advice.
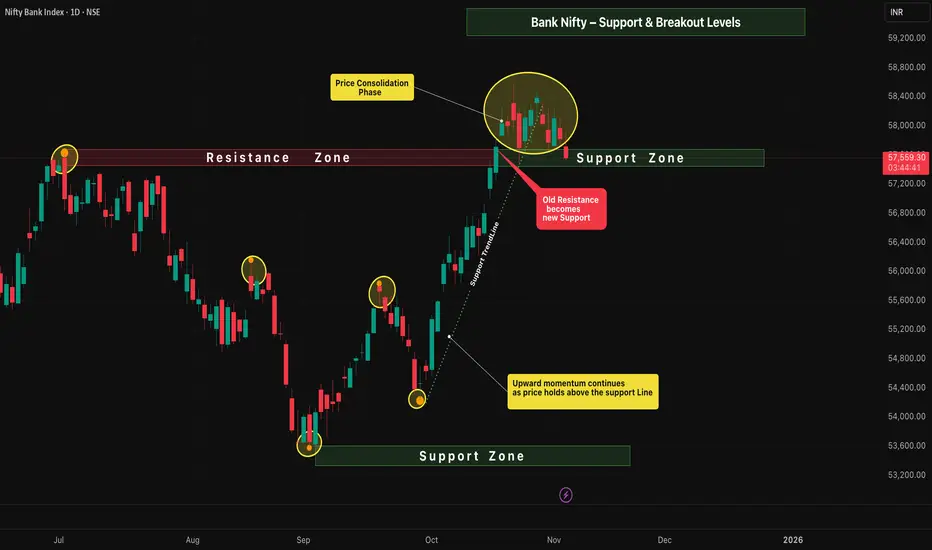
The price structure on the daily chart shows a healthy continuation of the upward momentum, maintaining strength above the key support zone.
Buyers are still in control, but the market has now entered a phase of sideways consolidation — signaling preparation for the next directional move.
⸻⸻⸻⸻⸻⸻⸻⸻⸻⸻
📊 Key Observations
1️⃣ Upward Momentum Continues — Price remains above the support line, showing sustained bullish control and healthy trend structure.
2️⃣ Consolidation Range — Price is currently consolidating between 58577.50 and 57482.05 , reflecting a balance between buyers and sellers.
3️⃣ Old Resistance → New Support — The previous resistance zone is now acting as a strong support base, adding confirmation to the bullish sentiment.
4️⃣ Breakout Scenarios —
A break above the consolidation high at 58,577.50 could ignite the next upward leg and continue the prevailing uptrend.
• A break below the support zone at 57,482.05 may shift momentum to the downside, opening the possibility of a move toward the previous support area.
⸻⸻⸻⸻⸻⸻⸻⸻⸻⸻⸻
✅ Summary
• Trend bias remains bullish as long as price holds above the key support line.
• Consolidation signals short-term indecision before the next major move.
• A confirmed breakout candle above 58,577.50 may open the path for further upside.
• Conversely, a breakdown below 57,482.05may invite short-term selling pressure toward the old support region.
⸻⸻⸻⸻⸻⸻⸻⸻⸻⸻⸻
⚠️ Disclaimer:
📘 For educational purposes only.
🙅 Not SEBI registered.
❌ Not a buy/sell recommendation.
🧠 Purely a learning resource.
📊 Not Financial Advice.
Disclaimer
The information and publications are not meant to be, and do not constitute, financial, investment, trading, or other types of advice or recommendations supplied or endorsed by TradingView. Read more in the Terms of Use.
Disclaimer
The information and publications are not meant to be, and do not constitute, financial, investment, trading, or other types of advice or recommendations supplied or endorsed by TradingView. Read more in the Terms of Use.