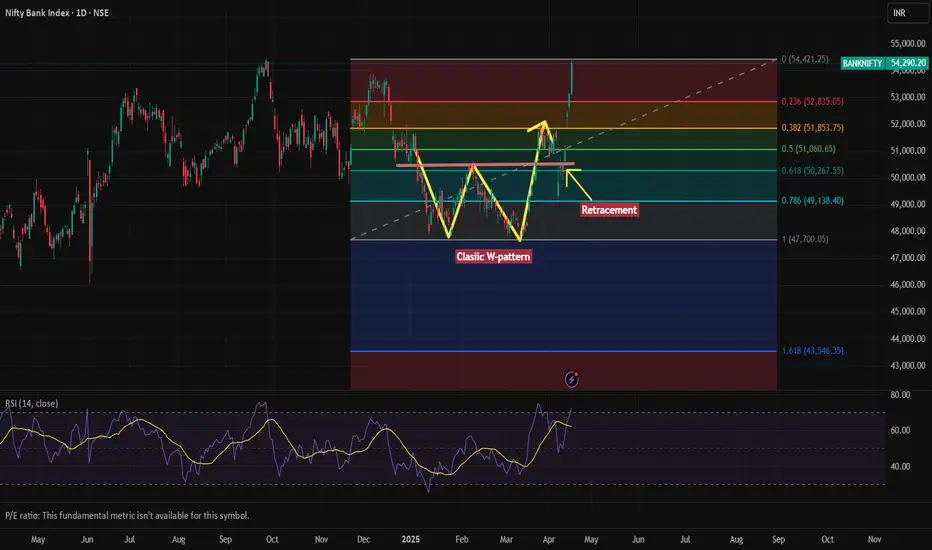
This chart represents the **Nifty Bank Index** (BANKNIFTY) on a daily timeframe and showcases a technical analysis using:
1. **Fibonacci Retracement Levels**
2. **A Classic W-Pattern (Double Bottom)**
3. **RSI (Relative Strength Index)** at the bottom
---
### 🔍 **Pattern Analysis**
#### 📈 Classic W-Pattern (Double Bottom)
- A W-pattern, also called a double bottom, typically indicates a **reversal from a downtrend to an uptrend**.
- It’s clearly marked in yellow, showing the index formed two distinct lows around the same level.
- This formation was followed by a **bullish breakout** above the neckline (horizontal resistance), confirming the pattern.
---
### 🔢 **Fibonacci Retracement Levels**
- The retracement tool is drawn from the swing high (around 54,421) to the swing low (around 43,546).
- Key levels marked:
- **0.236 (52,835)**
- **0.382 (51,853)**
- **0.5 (51,060)**
- **0.618 (50,267)**
- **0.786 (49,138)**
- The price **retraced to the 0.5-0.618 level** (a strong support zone) before resuming its uptrend — a typical bullish retracement behavior.
---
### 🔄 **Recent Breakout & Momentum**
- After retesting the neckline (as indicated by the arrow labeled “Retracement”), the price **broke above previous highs**, signaling strong bullish momentum.
- The latest candle shows a significant upward move, closing around **54,290**, very close to the **previous high of 54,421**, suggesting a potential **breakout into uncharted territory** if volume supports it.
---
### 📊 **RSI Indicator**
- RSI is around **72**, entering the **overbought zone (>70)**.
- This indicates **strong bullish momentum**, but could also suggest a potential for **short-term consolidation or minor correction**.
---
### ✅ Summary
- **Trend**: Strong bullish trend confirmed by W-pattern breakout and higher highs.
- **Support Levels**: 51,060 (0.5) and 50,267 (0.618) are key support zones.
- **Resistance**: Immediate resistance is the previous high at 54,421. A breakout above this could lead to new highs.
- **Momentum**: Overbought on RSI – bullish strength, but monitor for possible pullbacks.
Disclaimer
The information and publications are not meant to be, and do not constitute, financial, investment, trading, or other types of advice or recommendations supplied or endorsed by TradingView. Read more in the Terms of Use.
Disclaimer
The information and publications are not meant to be, and do not constitute, financial, investment, trading, or other types of advice or recommendations supplied or endorsed by TradingView. Read more in the Terms of Use.