Short
Bitcoin Cash chart is still down
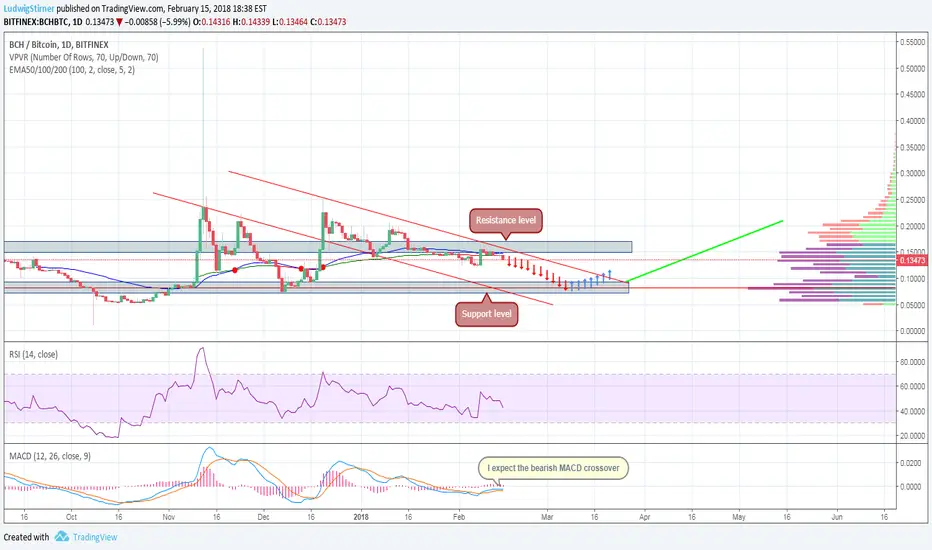
Long term, the trend of the Bitcoin Cash chart is still down. The 100-Day EMA provide significant resistance. The upper descending trend line also provide strong resistance.
RSI is below 50, a sign of an down trend. The MACD turned down but earlier the MACD showed positive divergence indicating the uptrend would begin however it might possible to be a fake buy signal.
RSI is below 50, a sign of an down trend. The MACD turned down but earlier the MACD showed positive divergence indicating the uptrend would begin however it might possible to be a fake buy signal.
Disclaimer
The information and publications are not meant to be, and do not constitute, financial, investment, trading, or other types of advice or recommendations supplied or endorsed by TradingView. Read more in the Terms of Use.
Disclaimer
The information and publications are not meant to be, and do not constitute, financial, investment, trading, or other types of advice or recommendations supplied or endorsed by TradingView. Read more in the Terms of Use.