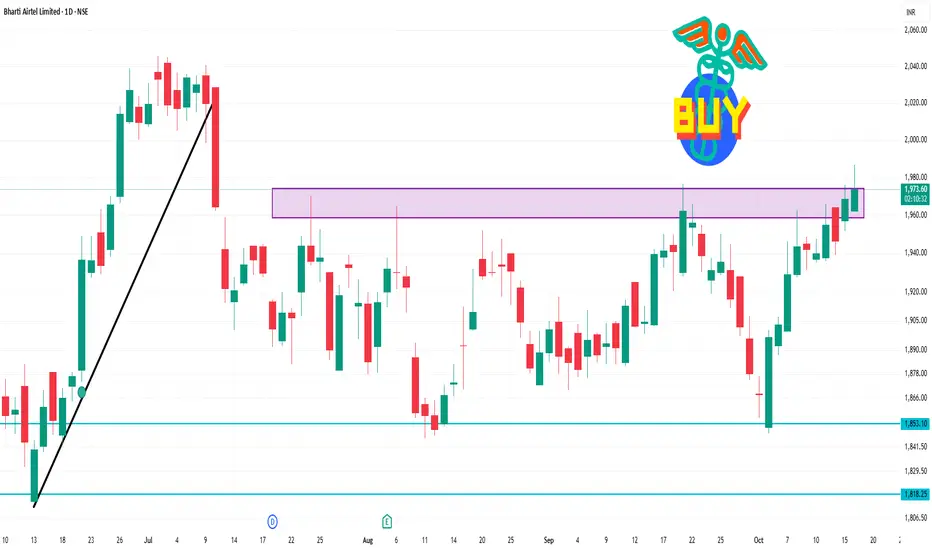
Bharti Airtel Limited is trading at ₹1,973.50, reflecting a 0.31% increase from the previous close.
Technical Analysis Overview (1-Day Time Frame):
Trend: Neutral to mildly bullish
Support Levels: ₹1,900 – ₹1,895
Resistance Levels: ₹1,920 – ₹1,925 and ₹1,950 – ₹1,960
Key Technical Indicators:
Moving Averages: All major moving averages (20-day, 50-day, 200-day) are bullish, indicating upward momentum.
Relative Strength Index (RSI): At 55.9, suggesting a neutral stance, neither overbought nor oversold.
Commodity Channel Index (CCI): At -214.32, indicating a bullish condition.
Momentum Oscillator: Positive, reinforcing the bullish outlook.
Average Directional Index (ADX): At 20.28, suggesting a neutral trend strength.
Related publications
Disclaimer
The information and publications are not meant to be, and do not constitute, financial, investment, trading, or other types of advice or recommendations supplied or endorsed by TradingView. Read more in the Terms of Use.
Related publications
Disclaimer
The information and publications are not meant to be, and do not constitute, financial, investment, trading, or other types of advice or recommendations supplied or endorsed by TradingView. Read more in the Terms of Use.