BHEL Stock Analysis
Analysis Highlights:
The stock is in a corrective phase but shows potential for a strong rebound from key support zones.
Short-term resistance at ₹255–₹260. Breakout above this could lead to a rally.
Action Plan: Accumulate in the buy zone for swing trading with controlled risk and solid upside potential.
Deeper and Educational Insights
Key Takeaways for Learning:
Always identify buy zones based on technical indicators like Fibonacci and chart patterns.
Use stop-loss orders to limit downside risk and protect capital.
Monitor resistance levels for partial exits and re-entry opportunities.
Conclusion:
This setup is a textbook example of combining Elliott Wave Theory with Fibonacci retracement. Traders can use this to plan entries, exits, and manage risks effectively. It’s a bullish scenario with clear targets and defined risk limits.
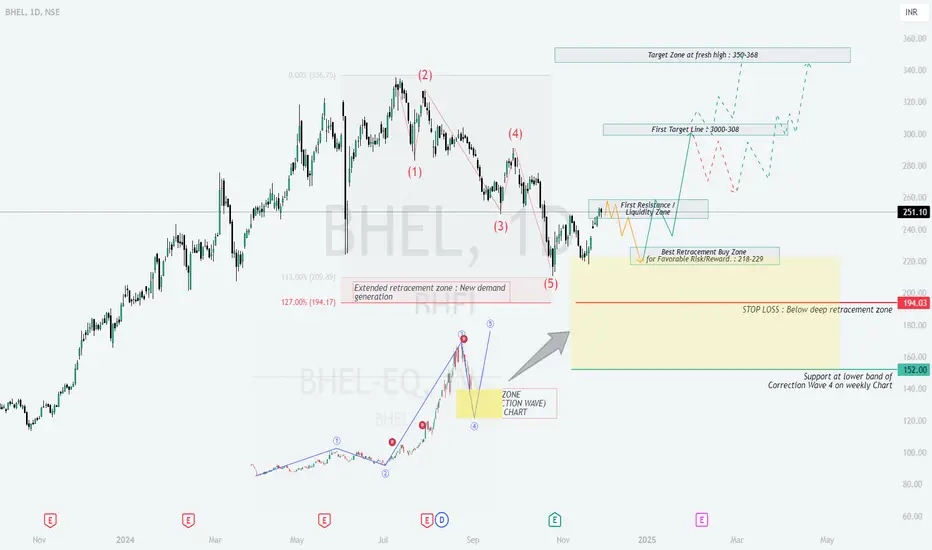
- []Entry Zone: ₹218–₹229 (Ideal buying range).
[]Targets:
First Target: ₹300–₹308.
Final Target: ₹350–₹368. - Stop Loss: ₹194 (Below the extended retracement zone).
Analysis Highlights:
The stock is in a corrective phase but shows potential for a strong rebound from key support zones.
Short-term resistance at ₹255–₹260. Breakout above this could lead to a rally.
Action Plan: Accumulate in the buy zone for swing trading with controlled risk and solid upside potential.
Deeper and Educational Insights
- Elliott Wave Theory Application:
The stock is completing corrective Wave 4-wave pattern. This is followed by a impulsive Wave 3, typically retracing a portion of the prior rally.
The retracement aligns with Fibonacci levels, highlighting ₹218–₹229 as a high-probability buy zone. - Key Levels to Watch:
Support Zones:
₹218–₹229: This is the primary retracement buy zone for a favorable risk/reward ratio.
₹152: The final support at the lower band of the correction zone on the weekly chart.
Resistance and Target Zones:
₹255–₹260: First resistance and liquidity zone. Expect price to pause or consolidate here.
₹300–₹308: First target zone, where partial profit booking is advisable.
₹350–₹368: Final target zone, marking a fresh high. - Risk Management:
Stop Loss: Place below ₹194 to limit downside risk. This aligns with the deep retracement zone and protects capital in case of extended corrections. - Entry Strategy:
Use staggered buying within ₹218–₹229. This method helps reduce risk exposure in case of volatility. - Market Psychology:
The current corrective phase represents profit-taking and demand generation. Once buyers regain momentum, the stock is likely to test higher resistance zones. - Why This Setup Works:
The retracement zone reflects institutional demand, and historical price action suggests strong support levels in this area.
The alignment with Fibonacci levels and Elliott Wave theory increases the probability of a successful trade.
Key Takeaways for Learning:
Always identify buy zones based on technical indicators like Fibonacci and chart patterns.
Use stop-loss orders to limit downside risk and protect capital.
Monitor resistance levels for partial exits and re-entry opportunities.
Conclusion:
This setup is a textbook example of combining Elliott Wave Theory with Fibonacci retracement. Traders can use this to plan entries, exits, and manage risks effectively. It’s a bullish scenario with clear targets and defined risk limits.
Disclaimer
The information and publications are not meant to be, and do not constitute, financial, investment, trading, or other types of advice or recommendations supplied or endorsed by TradingView. Read more in the Terms of Use.
Disclaimer
The information and publications are not meant to be, and do not constitute, financial, investment, trading, or other types of advice or recommendations supplied or endorsed by TradingView. Read more in the Terms of Use.