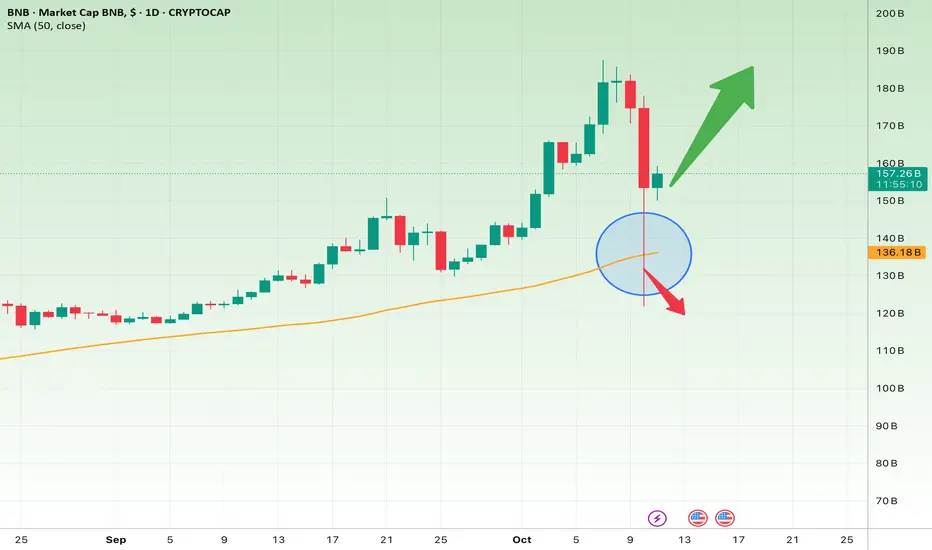
Short-Term Outlook (1–2 Weeks)
The BNB market cap has recently corrected sharply and is now testing its 50-day SMA around $136B, which acts as strong support.
If BNB can hold above $155B, a rebound toward $170B–$180B is likely.
However, a daily close below $136B would confirm weakness and may push the value down to $125B–$110B.
Short-Term Setup:
Entry Zone: Above $155B after confirmation
Targets: $170B → $180B
Stop Loss: Below $136B
Long-Term Outlook (1–3 Months)
The overall trend remains bullish, and the recent pullback to the SMA50 could be a healthy correction within that uptrend.
If the price stays above $140B–$150B, the next upside targets are $190B–$200B.
But a confirmed break below $136B would signal a structural shift and potential decline toward $110B.
Long-Term Setup:
Bullish Case: Hold above $140B → Targets: $190B → $200B
Stop Loss: Below $136B
Bearish Case: Break below $136B → Targets: $125B → $110B
Stop Loss: Reclaim above $145B
Summary:
BNB sits at a key decision zone. Holding $136B could spark a strong rebound, but losing that support may trigger a deeper correction in the coming weeks.
Disclaimer
The information and publications are not meant to be, and do not constitute, financial, investment, trading, or other types of advice or recommendations supplied or endorsed by TradingView. Read more in the Terms of Use.
Disclaimer
The information and publications are not meant to be, and do not constitute, financial, investment, trading, or other types of advice or recommendations supplied or endorsed by TradingView. Read more in the Terms of Use.