BTAF (BitcoinTAF Token) – Technical Analysis
BTAF (BitcoinTAF Token) – Technical Analysis
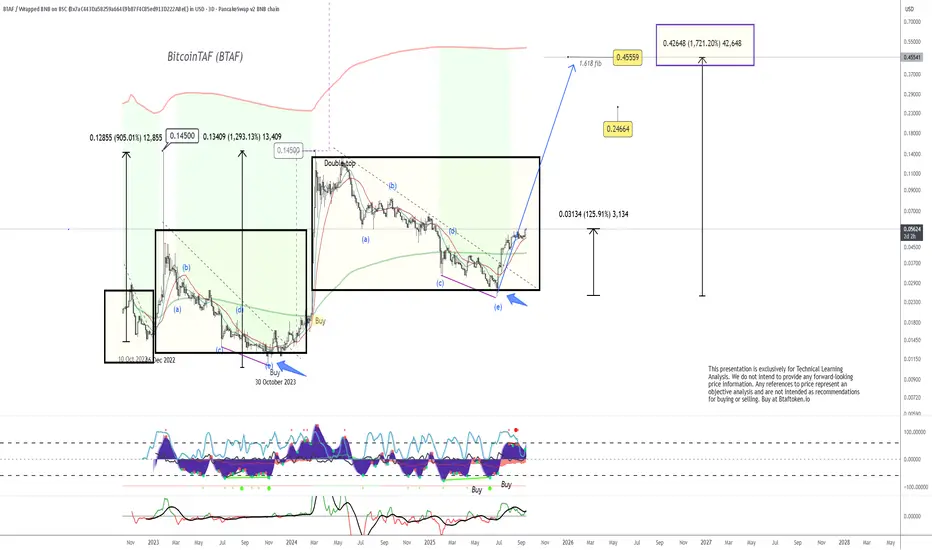
The chart highlights BTAF’s long-term cyclical structure, showing clear Elliott Wave patterns and Fibonacci extensions that point to significant potential upside.
Key Observations:
Historical Cycles:
BTAF previously delivered explosive rallies of +905% and +1,293% after consolidation phases.
Each cycle was marked by a corrective wave (ABCDE structure) before the next breakout move.
Current Structure:
The latest corrective phase (labeled wave (e)) appears to have completed.
Indicators are showing multiple Buy signals aligning with historical cycle lows.
The current price is building higher lows, with momentum turning upward.
Fibonacci Targets:
Immediate Fib target: $0.2466
Extension target: $0.4559 (1.618 Fib)
Long-term measured move: $0.4264 (+1,721%) relative to current support.
Momentum Indicators:
Oscillators confirm strength building from the base.
Buy signals have printed, similar to those seen in previous breakout phases.
Outlook:
If BTAF follows its established cycle patterns, the next bullish wave could target the $0.24 – $0.45 range, with potential for even higher levels over time. As always, pullbacks should be expected, but the technical structure remains constructive for long-term growth.
⚠️ Disclaimer: This analysis is for educational and technical learning purposes only. It is not financial advice or a recommendation to buy or sell. Always do your own research and manage risk responsibly.
Enjoy your trade!
BTAF
Marius Landman
Disclaimer
The information and publications are not meant to be, and do not constitute, financial, investment, trading, or other types of advice or recommendations supplied or endorsed by TradingView. Read more in the Terms of Use.
Marius Landman
Disclaimer
The information and publications are not meant to be, and do not constitute, financial, investment, trading, or other types of advice or recommendations supplied or endorsed by TradingView. Read more in the Terms of Use.