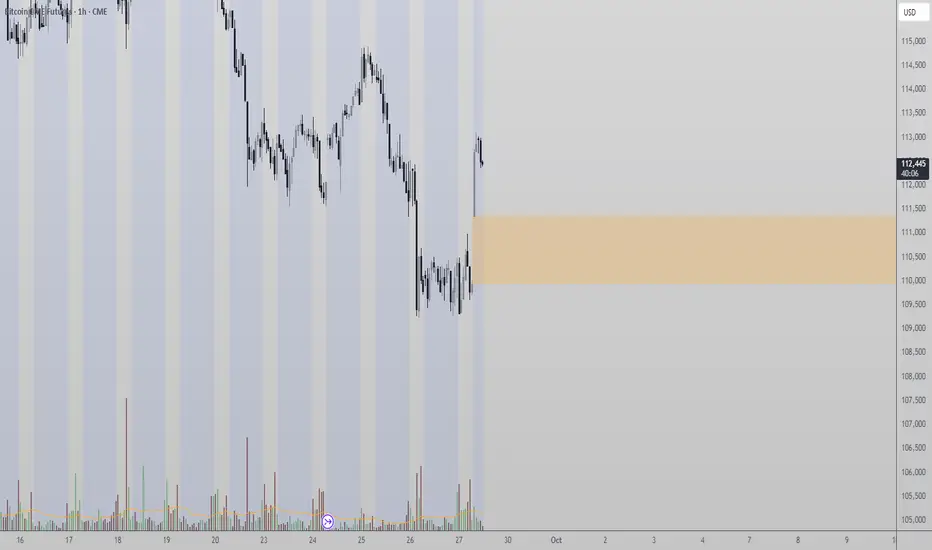
Bitcoin’s CME futures chart has revealed a gap between $109,000 and $111,000, a zone that historically carries a high likelihood of being filled. Timing, however, remains uncertain.
CME futures gaps are a widely recognized phenomenon in Bitcoin trading. These gaps often - act as magnets for price action, though they may be filled immediately or remain open for extended periods depending on broader market structure.
Key Technical Points:
-CME futures gap exists between $109K and $111K.
- Lower timeframe support levels will determine probability of early fill.
- Potential runaway gap scenario if long-term bullish trend persists.
The presence of a $109K–$111K gap on BTC’s CME futures chart has sparked discussions among traders. Historically, such gaps tend to fill, but the pathway is not always straightforward. If key lower timeframe supports break, the probability of a swift retracement to fill the gap increases. Conversely, if price holds its current bullish structure, this could evolve into a runaway gap, where the market continues higher and revisits the gap much later.
This dynamic requires traders to remain flexible, balancing short-term gap probabilities against the broader high-timeframe trend, which remains bullish.
What to Expect in the Coming Price Action:
If near-term supports fail, Bitcoin could quickly rotate into the $109K–$111K gap zone. If supports hold, expect the gap to remain open as a runaway gap, potentially being filled only after significant future retracement.
Join the Free Trading Group
Telegram: t.me/freetradingden 🔥
Claim $1000 Deposit Bonus 🎁
Trade with perks & support the community!
partner.blofin.com/d/TheAlchemist
Stay sharp, trade smart.
— Team The Alchemist ⚔️
Telegram: t.me/freetradingden 🔥
Claim $1000 Deposit Bonus 🎁
Trade with perks & support the community!
partner.blofin.com/d/TheAlchemist
Stay sharp, trade smart.
— Team The Alchemist ⚔️
Disclaimer
The information and publications are not meant to be, and do not constitute, financial, investment, trading, or other types of advice or recommendations supplied or endorsed by TradingView. Read more in the Terms of Use.