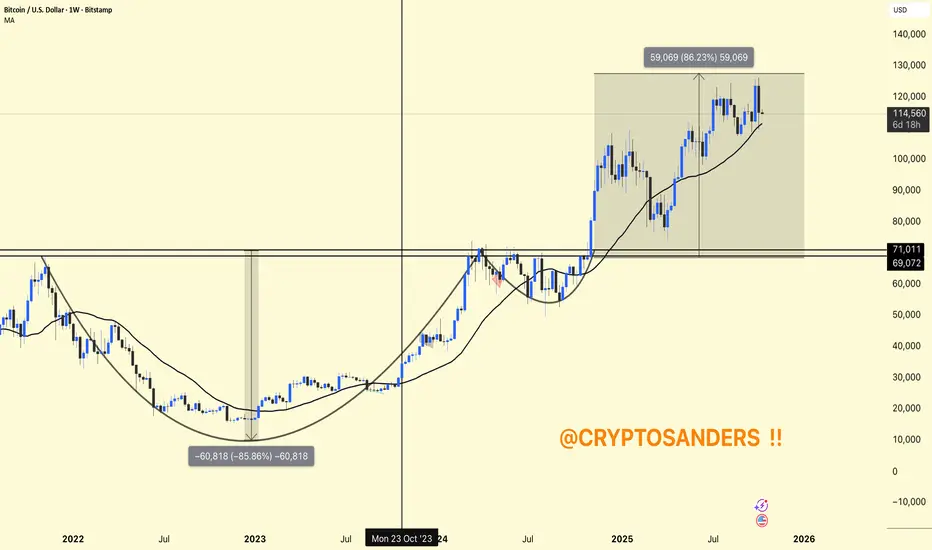
BTC/USDT Weekly Chart
Structure: The chart shows a complete market cycle – a deep correction (approximately -85%), followed by a strong recovery and breakout.
Current Area: Bitcoin is trading around $114K–$115K, holding above the 111K weekly MA (support).
Previous Resistance: The $69K–$71K area (old ATH) has now turned into a strong support zone.
Upward Momentum: From the breakout point (~$71K) to the recent high (~$130K), BTC gained approximately +86%, indicating strong bullish momentum.
Perspective: As long as the price remains above the $111K MA and does not lose support at $100K, the overall trend will remain bullish, and a retest of $130K–$135K is possible.
DYOR | NFA
Related publications
Disclaimer
The information and publications are not meant to be, and do not constitute, financial, investment, trading, or other types of advice or recommendations supplied or endorsed by TradingView. Read more in the Terms of Use.
Related publications
Disclaimer
The information and publications are not meant to be, and do not constitute, financial, investment, trading, or other types of advice or recommendations supplied or endorsed by TradingView. Read more in the Terms of Use.