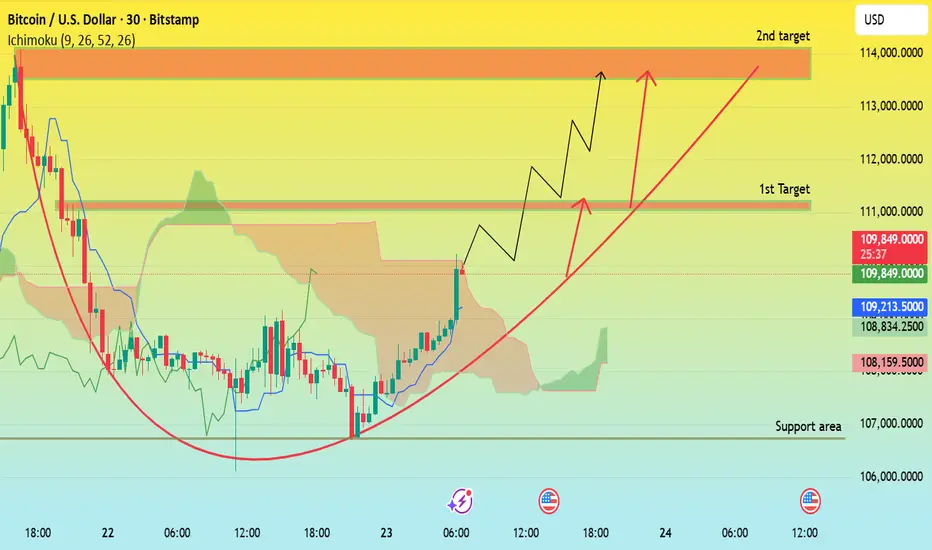
Bitcoin is forming a cup-shaped recovery pattern after a deep correction from the $114,000 area. The price has rebounded strongly from the $107,000 support zone, confirming buyer strength. It is now trading around $110,000, moving above the Ichimoku cloud — a signal of early bullish reversal.
If Bitcoin maintains its upward momentum and stays above the $109,200–$110,000 support, it could reach the first target near $111,000, which aligns with a key resistance level. A breakout above this zone may open the way toward the second target around $114,000, completing the bullish recovery.
However, if price fails to hold above the red rising trendline, a short-term pullback toward $108,000–$107,000 support could occur before another upward push. Overall bias remains bullish as long as the structure holds above the support zone.
Full-time Forex & Gold Trader | Market Analyst | Sharing Setups & Insights | Trade Smart, Trade Secure
t.me/+H3lZMgHrAO43ZDdk
daily provide 3-5 free signals with chart analysis
t.me/+H3lZMgHrAO43ZDdk
t.me/+H3lZMgHrAO43ZDdk
daily provide 3-5 free signals with chart analysis
t.me/+H3lZMgHrAO43ZDdk
Disclaimer
The information and publications are not meant to be, and do not constitute, financial, investment, trading, or other types of advice or recommendations supplied or endorsed by TradingView. Read more in the Terms of Use.