Trend Overview
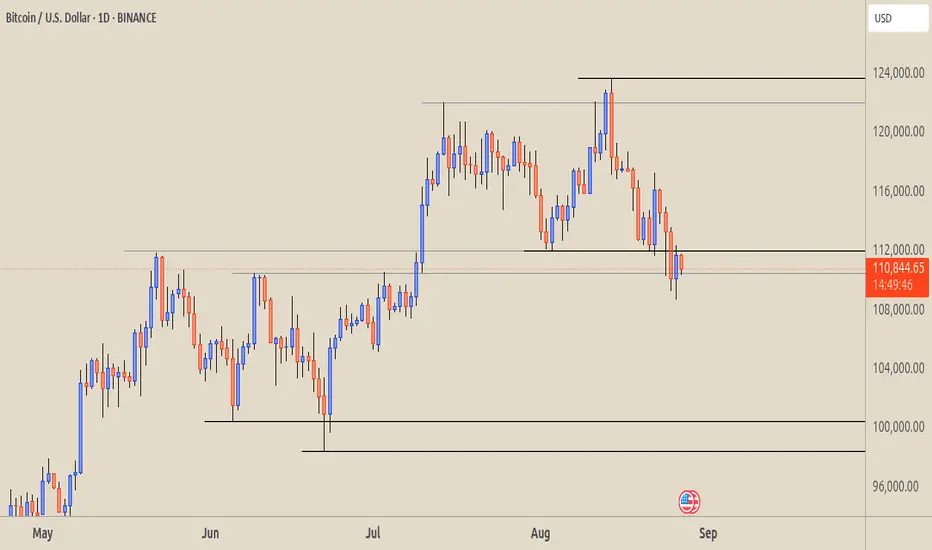
BTC is in a clear downtrend from the recent swing high near 123,731.
Multiple strong red candles show dominant selling pressure.
Price is currently struggling just below 111,971 resistance.
Key Resistance Levels
123,731 → Major swing high, strong supply zone.
111,971 → Nearest resistance. Price tested it and failed to break above (now acting as a ceiling).
Key Support Levels
Marked in green:
100,424 → First major support.
99,472 → Second support.
98,385 → Third support (deepest, last strong demand zone).
Price Action
Price attempted a bounce near 110,000, but failed to reclaim 111,971.
Multiple rejections confirm bears are still in control.
The wicks on the recent candles suggest buyers are defending, but momentum remains bearish.
Market Bias
Bearish bias dominates as long as BTC trades below 111,971.
A daily close under 110,000 could trigger a drop toward 100,400 – 98,300 zone.
Bullish case only if BTC breaks & closes above 111,971, which may allow a retest of 116,000 – 118,000 zone.
Trading Strategy Idea (Not Financial Advice)
Bearish Setup: Watch for rejection near 111,971 → short targets 100,400 – 98,300.
Bullish Setup: Only valid if daily closes above 111,971, with upside target 116,000 – 118,000.
Summary:
BTC daily chart is bearish, currently retesting broken support as resistance. If 111,971 holds, next major demand lies around 100K zone. Bulls need to regain 112K+ to invalidate bearish momentum.
Disclaimer
The information and publications are not meant to be, and do not constitute, financial, investment, trading, or other types of advice or recommendations supplied or endorsed by TradingView. Read more in the Terms of Use.
Disclaimer
The information and publications are not meant to be, and do not constitute, financial, investment, trading, or other types of advice or recommendations supplied or endorsed by TradingView. Read more in the Terms of Use.