Market context & structure
BTC has shown a steady climb into the current area: the market printed a sequence of higher lows through the first days of September and just produced a strong impulse leg into the 112k zone. That move carried price above a short-term trendline and absorbed nearby selling interest, which is bullish structure on the 1-hour timeframe. The recent pullback is shallow and looks like a classic retest of breakout area rather than a failure — buyers keep stepping in around the 107–109k region historically, which supports further upside attempts.
Technical reasons to be bullish (justification)
• Higher lows / higher highs pattern on the 1H — the structure favors continuation while this remains intact.
• Break & retest behavior: price cleared the minor resistance area near 110–112k and is holding above that band after the retest. That suggests a higher-probability long opportunity rather than a fresh breakout-fail.
• Clear targets and measured move: the chart’s long setup projects an upside objective near ~117,385, which aligns with a visible supply cluster and a logical liquidity magnet above current price.
• Healthy R:R on the plan: the trade on the chart shows a relatively small stop compared with the upside objective, producing a favorable reward-to-risk.
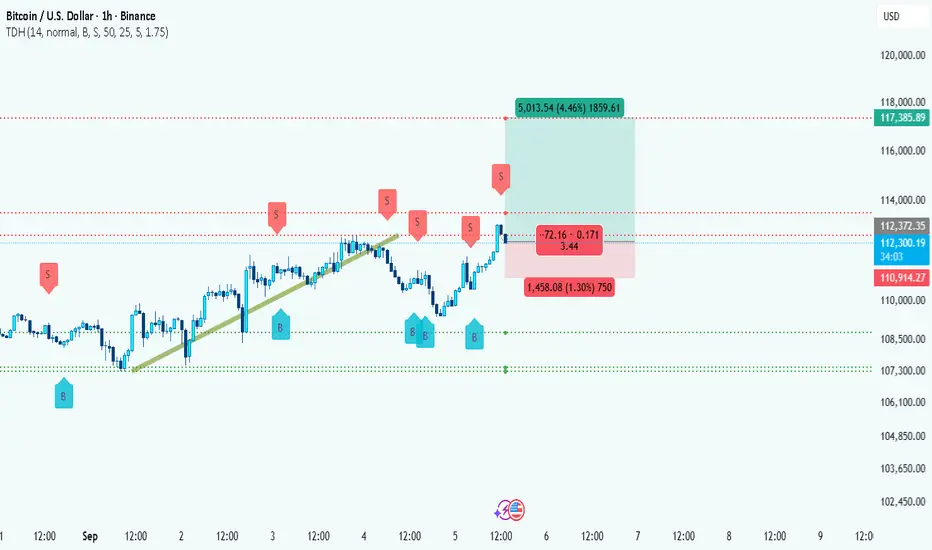
Key chart levels (visible on your image)
• Entry area: ~112,350 – 112,400 (current price zone).
• Stop (chart): 110,914 (invalidation below recent control).
• Primary target (T1 / chart): 117,385 (main upside objective / supply cluster).
• Lower support band to watch: ~107,300 – 108,800 (previous demand area; if price returns here buyers typically reappear).
________________________________________
Trade setup (clear, bullet format)
• Entry: Long around 112,350 – 112,400.
• Stop-loss: 110,914 (≈1,445 points below entry; ~1.3% risk).
• Take Profit (T1): 117,385 (~5,026 points above entry; ~4.5% upside).
• Risk : Reward: ≈ 3.5 : 1 (T1 vs SL).
________________________________________
Trade management & partial-profit rules
• Partial profit booking (recommended): take 30–40% off the position once the trade is ~+2% to +2.5% in profit (roughly 114,500 – 115,000 on this setup). Locking a portion early secures gains and reduces emotional pressure.
• After partials: move the stop on the remaining position to breakeven (entry) once the partial is taken — this converts the remaining position into a free trade.
• Trailing: for the rest, trail the stop under each 1H higher low as price advances (or use a volatility-based trail, e.g., 1.5× ATR(14,1H)). This captures extended upside while protecting profits.
• Second take profit: scale out another 30–40% near the charted target 117,385; leave a small runner if you want exposure to an extended move above that level.
• If price falls to SL: accept the loss and re-evaluate structure — a clean hourly close below 110,914 invalidates the bullish plan.
Risk and event notes
• Keep position sizing so the trade risk stays within your rule (commonly 1–2% of account).
• Be cautious around macro windows (FOMC, US data, high-impact crypto news) — these can cause slippage and sharp volatility on the 1H. Consider reducing size or tighter management near scheduled events.
• Watch for false breakouts: if price stalls and fails to hold the breakout band for several hourly closes, avoid scaling in further.
________________________________________
Short summary
The 1H structure favors a bullish continuation as long as price holds above the breakout/control band and 110,914. The charted plan offers a high R:R (~3.5:1) to ~117,385. Use staged profit-taking (30–40% at ~+2% — ~114.5k), move stop to breakeven, and trail the remainder under 1H higher lows to maximize capture while protecting gains.
Would you like those same levels formatted as a one-line social caption and a short post-ready blurb you can drop under the chart?
BTC has shown a steady climb into the current area: the market printed a sequence of higher lows through the first days of September and just produced a strong impulse leg into the 112k zone. That move carried price above a short-term trendline and absorbed nearby selling interest, which is bullish structure on the 1-hour timeframe. The recent pullback is shallow and looks like a classic retest of breakout area rather than a failure — buyers keep stepping in around the 107–109k region historically, which supports further upside attempts.
Technical reasons to be bullish (justification)
• Higher lows / higher highs pattern on the 1H — the structure favors continuation while this remains intact.
• Break & retest behavior: price cleared the minor resistance area near 110–112k and is holding above that band after the retest. That suggests a higher-probability long opportunity rather than a fresh breakout-fail.
• Clear targets and measured move: the chart’s long setup projects an upside objective near ~117,385, which aligns with a visible supply cluster and a logical liquidity magnet above current price.
• Healthy R:R on the plan: the trade on the chart shows a relatively small stop compared with the upside objective, producing a favorable reward-to-risk.
Key chart levels (visible on your image)
• Entry area: ~112,350 – 112,400 (current price zone).
• Stop (chart): 110,914 (invalidation below recent control).
• Primary target (T1 / chart): 117,385 (main upside objective / supply cluster).
• Lower support band to watch: ~107,300 – 108,800 (previous demand area; if price returns here buyers typically reappear).
________________________________________
Trade setup (clear, bullet format)
• Entry: Long around 112,350 – 112,400.
• Stop-loss: 110,914 (≈1,445 points below entry; ~1.3% risk).
• Take Profit (T1): 117,385 (~5,026 points above entry; ~4.5% upside).
• Risk : Reward: ≈ 3.5 : 1 (T1 vs SL).
________________________________________
Trade management & partial-profit rules
• Partial profit booking (recommended): take 30–40% off the position once the trade is ~+2% to +2.5% in profit (roughly 114,500 – 115,000 on this setup). Locking a portion early secures gains and reduces emotional pressure.
• After partials: move the stop on the remaining position to breakeven (entry) once the partial is taken — this converts the remaining position into a free trade.
• Trailing: for the rest, trail the stop under each 1H higher low as price advances (or use a volatility-based trail, e.g., 1.5× ATR(14,1H)). This captures extended upside while protecting profits.
• Second take profit: scale out another 30–40% near the charted target 117,385; leave a small runner if you want exposure to an extended move above that level.
• If price falls to SL: accept the loss and re-evaluate structure — a clean hourly close below 110,914 invalidates the bullish plan.
Risk and event notes
• Keep position sizing so the trade risk stays within your rule (commonly 1–2% of account).
• Be cautious around macro windows (FOMC, US data, high-impact crypto news) — these can cause slippage and sharp volatility on the 1H. Consider reducing size or tighter management near scheduled events.
• Watch for false breakouts: if price stalls and fails to hold the breakout band for several hourly closes, avoid scaling in further.
________________________________________
Short summary
The 1H structure favors a bullish continuation as long as price holds above the breakout/control band and 110,914. The charted plan offers a high R:R (~3.5:1) to ~117,385. Use staged profit-taking (30–40% at ~+2% — ~114.5k), move stop to breakeven, and trail the remainder under 1H higher lows to maximize capture while protecting gains.
Would you like those same levels formatted as a one-line social caption and a short post-ready blurb you can drop under the chart?
Trade forex, indices, stocks and metals with up to US$100.000 in company's funding.
Complete a challenge to access funding or go for instant deposit.
Trading involves substantial risk. Not financial advice
Complete a challenge to access funding or go for instant deposit.
Trading involves substantial risk. Not financial advice
Related publications
Disclaimer
The information and publications are not meant to be, and do not constitute, financial, investment, trading, or other types of advice or recommendations supplied or endorsed by TradingView. Read more in the Terms of Use.