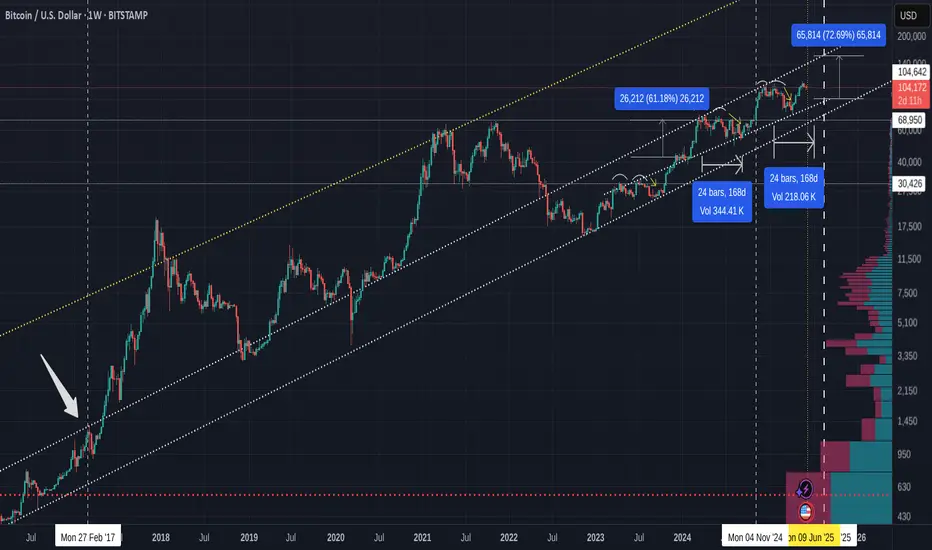
The chart says it all
This is a chart I have used here iften but never zoomed out.
That line has rejected us 3 times now this cycle.
It was just once in 2017 but once Crossed, tested and held, it is a mighty line of support.
This maybe why the Bears do not want us to cross it......
But I have little doubt that Bitcoin has the ability to cross it....
There aew many reasons why we have not done so, Technical and Macro and I really am beginning to think that we will have a lazy Summer, ranging across, maybe reaching another small ATH before we really go for it in late Q3 / Q4
BUT, I could be wrong.
Just my opibion
Nothing to be taken as Financial advice.
I will always say
"Only invest what you can afford to loose. When you are ready, take out your original investment. This way, it is only your profit that is at risk"
THAT is Financial advice
I will always say
"Only invest what you can afford to loose. When you are ready, take out your original investment. This way, it is only your profit that is at risk"
THAT is Financial advice
Disclaimer
The information and publications are not meant to be, and do not constitute, financial, investment, trading, or other types of advice or recommendations supplied or endorsed by TradingView. Read more in the Terms of Use.