A Phase-by-Phase Breakdown of the Bitcoin Chart
(Refer to your chart, which will be the main feature of the post)
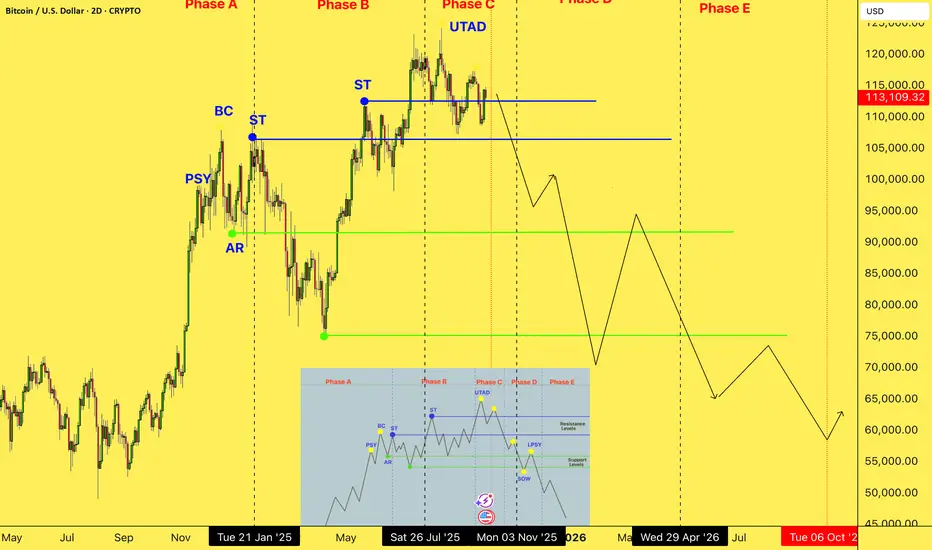
Now, look at the Bitcoin chart. The resemblance to a textbook example is striking:
Phase A (Stopping the Trend): We saw the Preliminary Supply (PSY) and the Buying Climax (BC), where the uptrend began to lose momentum.
Phase B (Building the "Cause"): A prolonged consolidation range where "smart money" began to carefully distribute their positions without crashing the price.
Phase C (The Final Trap): The most critical phase. We witnessed the UTAD (Upthrust After Distribution)—a final push upward that created the illusion of a continued rally. This is the moment of peak euphoria, designed to trap the last buyers. This is precisely where we are now.
Phase D & E (The Markdown): As the schematic shows, after Phase C, a sustained decline (the Markdown) begins, which marks the start of the bear market. The projected trajectory on the chart aligns perfectly with my plan to stay out of the market until September 2026.
(Refer to your chart, which will be the main feature of the post)
Now, look at the Bitcoin chart. The resemblance to a textbook example is striking:
Phase A (Stopping the Trend): We saw the Preliminary Supply (PSY) and the Buying Climax (BC), where the uptrend began to lose momentum.
Phase B (Building the "Cause"): A prolonged consolidation range where "smart money" began to carefully distribute their positions without crashing the price.
Phase C (The Final Trap): The most critical phase. We witnessed the UTAD (Upthrust After Distribution)—a final push upward that created the illusion of a continued rally. This is the moment of peak euphoria, designed to trap the last buyers. This is precisely where we are now.
Phase D & E (The Markdown): As the schematic shows, after Phase C, a sustained decline (the Markdown) begins, which marks the start of the bear market. The projected trajectory on the chart aligns perfectly with my plan to stay out of the market until September 2026.
Disclaimer
The information and publications are not meant to be, and do not constitute, financial, investment, trading, or other types of advice or recommendations supplied or endorsed by TradingView. Read more in the Terms of Use.
Disclaimer
The information and publications are not meant to be, and do not constitute, financial, investment, trading, or other types of advice or recommendations supplied or endorsed by TradingView. Read more in the Terms of Use.