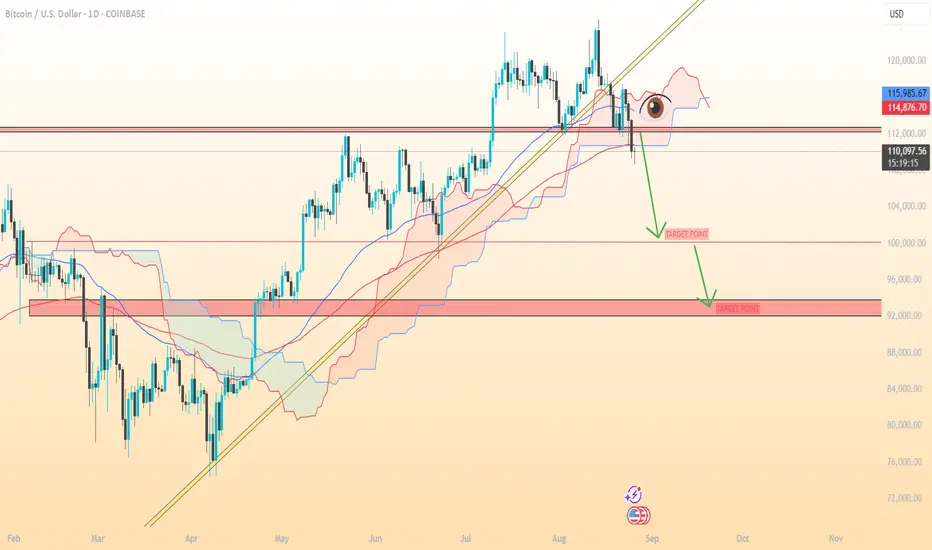
BTC/USD chart drawn support/resistance levels and target zones. Let’s break it down:
📉 Current Situation
Price is around $110,051.
It has broken below a trendline and the Ichimoku cloud, suggesting bearish momentum.
The my chart shows two potential downside target points.
🎯 Target Levels (as per your chart)
1. First Target Zone: Around $100,000 – $102,000
(Marked by the first horizontal red zone, likely a strong support level).
2. Second Target Zone: Around $92,000 – $94,000
(The larger red zone further below, which looks like a major support and final bearish target).
⚠ Notes
These targets assume the bearish trend continues without strong reversal signals.
If BTC bounces back above $114,000 – $116,000, it may invalidate the bearish targets.
Always use stop-loss risk management since BTC can move sharply.
Trade active
trade active📲 Join telegram channel free ..
t.me/RSI_Trading_Point4
Forex, Gold & Crypto Signals with detailed analysis & get consistent results..
t.me/XauusdGlobalSignal17
Gold Signal's with proper TP & SL for high profit opportunities..
t.me/RSI_Trading_Point4
Forex, Gold & Crypto Signals with detailed analysis & get consistent results..
t.me/XauusdGlobalSignal17
Gold Signal's with proper TP & SL for high profit opportunities..
Related publications
Disclaimer
The information and publications are not meant to be, and do not constitute, financial, investment, trading, or other types of advice or recommendations supplied or endorsed by TradingView. Read more in the Terms of Use.
📲 Join telegram channel free ..
t.me/RSI_Trading_Point4
Forex, Gold & Crypto Signals with detailed analysis & get consistent results..
t.me/XauusdGlobalSignal17
Gold Signal's with proper TP & SL for high profit opportunities..
t.me/RSI_Trading_Point4
Forex, Gold & Crypto Signals with detailed analysis & get consistent results..
t.me/XauusdGlobalSignal17
Gold Signal's with proper TP & SL for high profit opportunities..
Related publications
Disclaimer
The information and publications are not meant to be, and do not constitute, financial, investment, trading, or other types of advice or recommendations supplied or endorsed by TradingView. Read more in the Terms of Use.