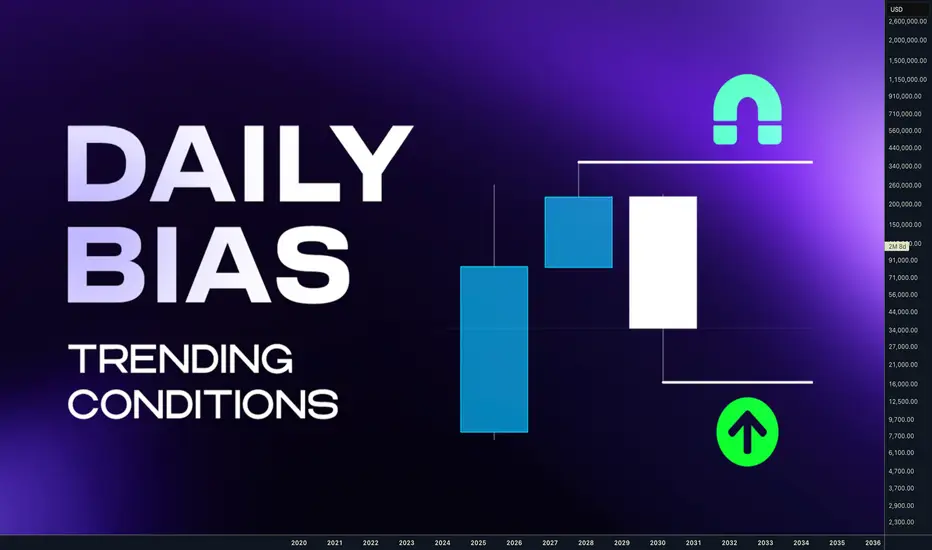
Hey traders today we are going to look in how to determine Daily Bias. Its actually not that complicated how many people thinks.
Please forget about higher highs, and higher lows, channels and moving averages. Yes these can be also used, but we will be looking at the market in terms where is the liquidity and we will be determining the bias based on candle closes which tell us where the liquidity is resting.
We will look at the Daily bias, but as I mentioned this many times in my posts - price is fractal so you can use this at any timeframe. But, If I can give you recommendations look for Higher timeframe bias on Daily and Weekly and H4 / H1 Structure and M15 entries.
This post will be about continuation setups in a trend, I will touch a bit reversal because it's part of setup on LTF in the continuation. Something will be shown on bearish examples something bullish I hope you can use imagination for both sides.
⁉️Where is the liquidity ? Always follow the Daily / Weekly candle close.
📈 Continuation
If todays daily candle closed above previous days high and its still not reaching the key level, then liquidity is above todays high. Why ? Because people have intentions to sell highs to early, so and price will most likely go there. So we are bullish. Bullish Close 📈 Reversal
If todays candle wicked above previous day high, but closed below , then we can expect liquidity is below Previous days low. Why? Because mostl likely traders entered fake high break out they put SL below days low. It's signs of reversal. Every significant reversal wicked above PDH and closed inside, if not seen on PDH than its on weekly.
  ‼️ Yes, Its that simple - this is how I predict my bias for the setups.
There is obviously little bit more regarding the market context, because I want to be always selling highs and buying lows. Hence there must but pullback deep enough. I have explained how to buy low and sell highs in this post below. 🔗Click the picture to learn more 👇 This is not about catching every significant highs and lows, you don't need it to be profitable. We are looking for the high probability trend continuation setups. We can catch highs and lows in the trend. After the stop hunt.
🧪In downtrend you want sell after stop hunt of short term highs 🧪In the uptrend you want be buying after stop hunts of short term lows
  I have explained more about stop hunts in this post. 🔗Click the picture to learn more 👇
 Now, If we know the bias based on the Daily / Weekly candle close our goal is to position ourself in the right time for the continuation setup which will be during the lower timeframe reversal.
📌Reversal Setup
first lets have a look to the reversal. We want see a candle high being taken and closed below. In that case draw on liquidity is below the daily low. Sign of reversal. So we can position ourselves in a trade as described on the picture, wick above and close inside is not enough for the signifcant HTF reversal. But its enough for our continuation setup,
📌Continuation setup
We want to see bullish candle close above previous days high and not liquidity taken above that wick. Then we can assume that liquidity is still resting above and we want to position ourselves during the LTF reversal in the direction of the HTF liquidity. same case will be for this bearish example where we can see how candles closed below the previous days low and last low was not swept hence we can expect price to visit that low again, we have spotted potential reversal by wicking above the candles high and close below and than we can position ourselves to the short and target daily lows.
  📌 Continuation LTF reversal timing
same case now you must already see it bullish close above PDH and that high was not swept so liquidity is still above , next day is inside candle once price dips below inside candle low we cans spot reversal setup on LTF and by creation of order block we enter the position during the NY session manipulation 📌 No Stop hunt = No trade
if liquidity was not taken don't enter. Yes you can miss a trade it doesnt happen always, but if it doesnt happen it's not your setup so you didnt miss anything. On this example you can see that we had almost same setup. Bullish daily candle close. High was not swept, and than 2 inside candles. 3 candle manipulated lows and another candle was expansion. Now still focus the the picture above 2nd candle that candle is a range you are entering it after that range was manipulated. Look how price reached 50% of that range , retraced and than it went full range. Its Trading model 1 and Model 2. You mostly get 2 chances to trade it.
  Trading ranges is in my opinion least subjective approach and unlike diagonal drawings or multiple various pattern it has defined rules. I have described this strategy in details in this post below. 🔗 Click the picture to learn more 👇
 📌 Final example for today - Schematics
Now try it alone - step by step
1) How are candles closing
2) Was the Liquidity on the low taken ? No - price might go there - Im bearish
3) Lets wait for the LTF reversal - bearish this scheme was actually traded and posted here on Tradingview as a Continuation setup Model 1 & 2 🔗 Click picture below to learn how price action developed👇
  💊 Here are few more examples based on this trading logic
1️⃣GBPUSD Daily range - Continuation setup Model 1 & 2
🔗 Click picture below to learn how price action developed 👇 2️⃣AUDUSD Daily range - Continuation setup Model 1 & 2
🔗 Click picture below to learn how price action developed 👇 3️⃣DOGE Daily range - Continuation setup Model 1 & 2
🔗 Click picture below to learn how price action developed 👇 Final words
Is this holy grail ? Almost.
Why is this approach great ? It's mechanical system for analysis - No subjective guessing.
Does it prevent me from losses ? No, I can make and I sometimes I do mistakes in analysis, Im not perfect.
Dont trust me , Im just a guy from the internet. Verify it by yourself and see if you take some of it to your trading arsenal.
Adapt useful, Reject useless and something specifically your own.
David Perk aka Dave Fx Hunter
Please forget about higher highs, and higher lows, channels and moving averages. Yes these can be also used, but we will be looking at the market in terms where is the liquidity and we will be determining the bias based on candle closes which tell us where the liquidity is resting.
We will look at the Daily bias, but as I mentioned this many times in my posts - price is fractal so you can use this at any timeframe. But, If I can give you recommendations look for Higher timeframe bias on Daily and Weekly and H4 / H1 Structure and M15 entries.
This post will be about continuation setups in a trend, I will touch a bit reversal because it's part of setup on LTF in the continuation. Something will be shown on bearish examples something bullish I hope you can use imagination for both sides.
⁉️Where is the liquidity ? Always follow the Daily / Weekly candle close.
📈 Continuation
If todays daily candle closed above previous days high and its still not reaching the key level, then liquidity is above todays high. Why ? Because people have intentions to sell highs to early, so and price will most likely go there. So we are bullish. Bullish Close
If todays candle wicked above previous day high, but closed below , then we can expect liquidity is below Previous days low. Why? Because mostl likely traders entered fake high break out they put SL below days low. It's signs of reversal.
There is obviously little bit more regarding the market context, because I want to be always selling highs and buying lows. Hence there must but pullback deep enough. I have explained how to buy low and sell highs in this post below. 🔗Click the picture to learn more 👇
🧪In downtrend you want sell after stop hunt of short term highs
📌Reversal Setup
first lets have a look to the reversal. We want see a candle high being taken and closed below. In that case draw on liquidity is below the daily low. Sign of reversal. So we can position ourselves in a trade
📌Continuation setup
We want to see bullish candle close above previous days high and not liquidity taken above that wick. Then we can assume that liquidity is still resting above and we want to position ourselves during the LTF reversal in the direction of the HTF liquidity.
same case now you must already see it bullish close above PDH and that high was not swept so liquidity is still above , next day is inside candle once price dips below inside candle low we cans spot reversal setup on LTF and by creation of order block we enter the position during the NY session manipulation
if liquidity was not taken don't enter. Yes you can miss a trade it doesnt happen always, but if it doesnt happen it's not your setup so you didnt miss anything. On this example you can see that we had almost same setup. Bullish daily candle close. High was not swept, and than 2 inside candles. 3 candle manipulated lows and another candle was expansion.
Now try it alone - step by step
1) How are candles closing
2) Was the Liquidity on the low taken ? No - price might go there - Im bearish
3) Lets wait for the LTF reversal - bearish
1️⃣GBPUSD Daily range - Continuation setup Model 1 & 2
🔗 Click picture below to learn how price action developed 👇
🔗 Click picture below to learn how price action developed 👇
🔗 Click picture below to learn how price action developed 👇
Is this holy grail ? Almost.
Why is this approach great ? It's mechanical system for analysis - No subjective guessing.
Does it prevent me from losses ? No, I can make and I sometimes I do mistakes in analysis, Im not perfect.
Dont trust me , Im just a guy from the internet. Verify it by yourself and see if you take some of it to your trading arsenal.
Adapt useful, Reject useless and something specifically your own.
David Perk aka Dave Fx Hunter
Related publications
Disclaimer
The information and publications are not meant to be, and do not constitute, financial, investment, trading, or other types of advice or recommendations supplied or endorsed by TradingView. Read more in the Terms of Use.
Related publications
Disclaimer
The information and publications are not meant to be, and do not constitute, financial, investment, trading, or other types of advice or recommendations supplied or endorsed by TradingView. Read more in the Terms of Use.