Everything on this chart starts/runs on symmetry and time tested areas. It's my belief that in crypto the API linked exchanges do a good job keeping the prices in sync. However, With this there is a backlog of prices that each exchange needs to retest because there were so many orders to buy, some exchanges did not have the sell orders to actually fill the buys. This means the only way to level the books is to retest the area (range) until that price level has averaged its books.
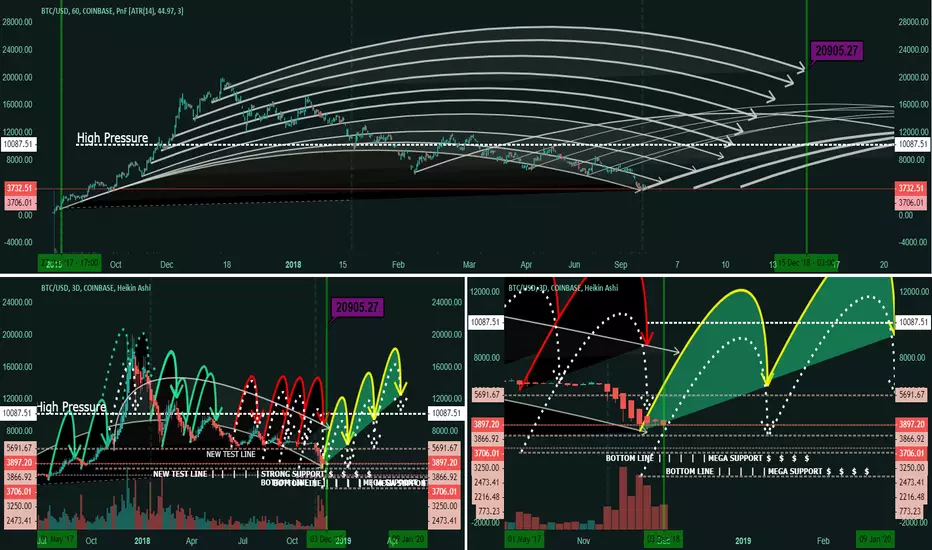
The top chart have identical curve lines that are attached to many test areas. The 1st of these lines is at the current price to the start of the bull run. The arrows at the end of the top chart, show what can happen based on previous movements. Tom Lee has stated that we can get back to 20k this year and since moved his prediction down. In the top chart we see that this could still happen. I'm not saying it will but It would be a mistake to say that it CAN'T HAPPEN.
Last but not least, I came across what I am calling "the golden arch" this appears to be able to locate upcoming price points and if it misses the mark, an additional (dotted arrow) can be added to the actual price to locate a new test line or support in the future.
As always, I share these very unique ideas to help other who have done the research or what to look for other ways to confirm their own ideas. Please do your own research. Happy Holidays and feel free to discuss.
Disclaimer
The information and publications are not meant to be, and do not constitute, financial, investment, trading, or other types of advice or recommendations supplied or endorsed by TradingView. Read more in the Terms of Use.
Disclaimer
The information and publications are not meant to be, and do not constitute, financial, investment, trading, or other types of advice or recommendations supplied or endorsed by TradingView. Read more in the Terms of Use.