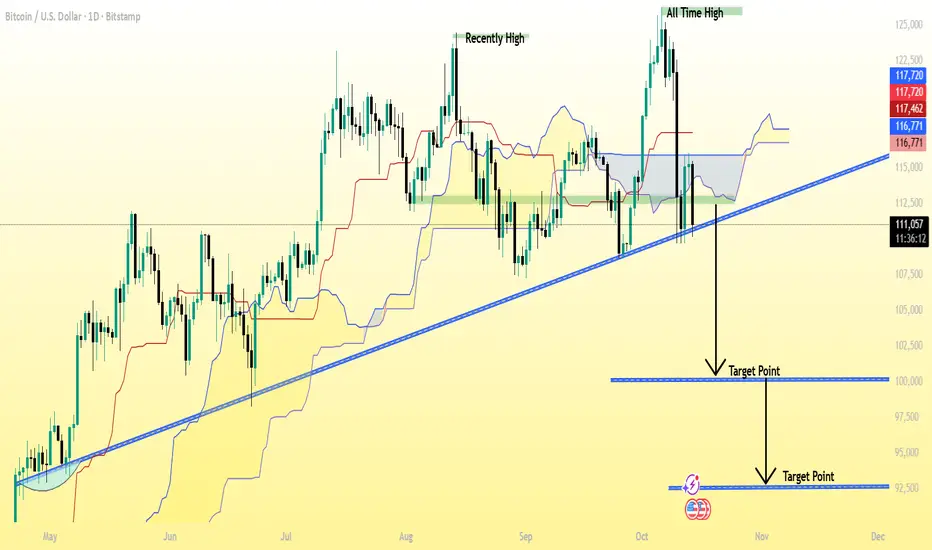
BTC/USD (Bitcoin) 1D (Daily) chart 👇
✅ Current Price: around $110,685
✅ Trend: Bearish breakdown — price has clearly broken below the long-term ascending trendline.
✅ Market structure: After rejecting near $117,000, BTC dropped below both the Ichimoku cloud and the trendline — confirming downside pressure.
---
🎯 Target Levels (Downside)
1. Primary Target: $100,000 – $98,000
2. Extended / Final Target: $94,000 – $92,000
This is the second target point shown on my chart.
It would be the next major support if BTC continues falling after $98,000 breaks.
---
🛡 Resistance / Stop-Loss
Immediate resistance: $113,000 – $114,000 (broken trendline retest zone).
Stop-loss for short trades: above $115,000 – $116,000 (invalidates bearish setup).
---
🔍 Summary
Trend bias: Bearish (break of trendline + below cloud)
Sell zone: $111,000 – $113,000
Target 1: $100,000 – $98,000
Target 2: $94,000 – $93,000
Stop-loss: above $115,000
Related publications
Disclaimer
The information and publications are not meant to be, and do not constitute, financial, investment, trading, or other types of advice or recommendations supplied or endorsed by TradingView. Read more in the Terms of Use.
Related publications
Disclaimer
The information and publications are not meant to be, and do not constitute, financial, investment, trading, or other types of advice or recommendations supplied or endorsed by TradingView. Read more in the Terms of Use.