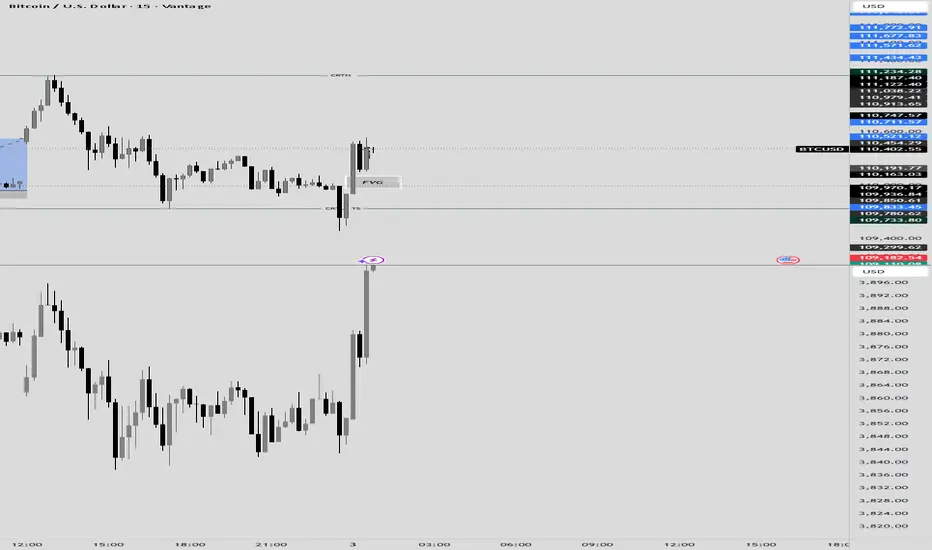
🚀 BTC/USD 5M - Short-Term Analysis: Bullish Displacement & FVG Fill the 5-minute chart for Bitcoin shows a significant shift in immediate order flow, characterized by a liquidity sweep followed by a strong displacement that left behind a clear price imbalance.
📊 Structure and Key LevelsCRTL + TS ($109,780.62 - $109,850.61): This zone marks a "Clear Run on the Low" (CRTL) or "True Stop-run" (TS). Price dipped below prior lows to trigger sell stops/liquidity, then immediately reversed higher. This is a classic sign of liquidity collection by institutional buyers.
FVG (Fair Value Gap/Imbalance): The strong green candles following the sweep created a significant Fair Value Gap between approximately $110,163.03 and $110,191.77. Price has recently retraced precisely into this gap.CRTH ($111,234.28): This level (a "Clear Run on the High") represents the major Buy-Side Liquidity (BSL) target that has been left un-tested and is the most likely destination for the next bullish move.
📈 Current Price Action and BiasThe chart shows a high-probability "Sweep $\rightarrow$ Displacement $\rightarrow$ Retrace to FVG" setup, which strongly favors continuation in the direction of the displacement (upward).
Stop Hunt Complete:
The market has successfully collected sell-side liquidity, providing the fuel for the move up.FVG Retest: Price has returned to the Fair Value Gap to effectively "fill" the imbalance created by the aggressive buying. This zone acts as a high-probability demand zone or entry point for bulls.
Bullish Confirmation: As long as price holds above the low of the liquidity sweep ($109,780.62), the immediate bias is bullish.
🎯 Trade Expectation
Entry: Look for confirmation (strong bullish candles or lower-timeframe shift) within or just below the FVG area.Target 1 (Liquidity): The primary target is the CRTH at $111,234.28 to clear the buy-side liquidity resting above those highs.Invalidation: A decisive close below the CRTL + TS zone (below $109,780.62) would invalidate the bullish structure and suggest a deeper drop toward the lower liquidity/support at $109,000.
Disclaimer
The information and publications are not meant to be, and do not constitute, financial, investment, trading, or other types of advice or recommendations supplied or endorsed by TradingView. Read more in the Terms of Use.
Disclaimer
The information and publications are not meant to be, and do not constitute, financial, investment, trading, or other types of advice or recommendations supplied or endorsed by TradingView. Read more in the Terms of Use.