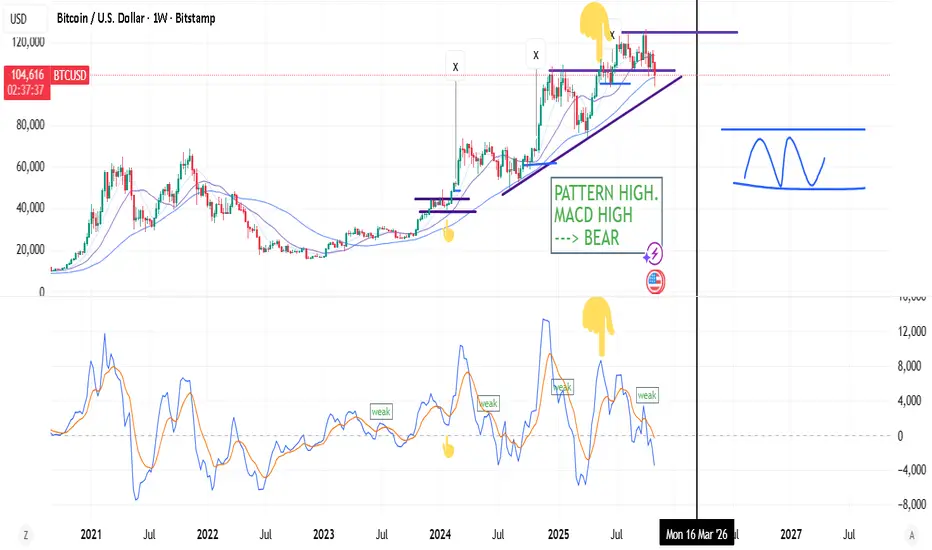
If you combine basic FACTORS of Patterns + MACD (weaknesses or Lows/Highs) you get pretty straightforward probability.
Weekly MACD above zero (and daily macd above zero) mean strong impulse, trend. But sometimes deep corrections in negative territory (bears) are not negative, because every chart pattern require strong "push" to break the pattern. I think you can see if there's smoke, in advance.
Weekly MACD above zero (and daily macd above zero) mean strong impulse, trend. But sometimes deep corrections in negative territory (bears) are not negative, because every chart pattern require strong "push" to break the pattern. I think you can see if there's smoke, in advance.
Note
Weekly HIGH macd + Pattern HIGH = sh*t odds. etcNote

all things equal. December looks like ready for a push. And 2nd push in early 2026.
Note
because of 10/20/50 slope. Note
think earlier success is probable, but it will be volatile till december. AKA FUD. Note
Maybe and likely things fly in second half of November, because 50dma crossover is out. which means the end of correction per se?, ignoring the VIX and outside influence.Related publications
Disclaimer
The information and publications are not meant to be, and do not constitute, financial, investment, trading, or other types of advice or recommendations supplied or endorsed by TradingView. Read more in the Terms of Use.
Related publications
Disclaimer
The information and publications are not meant to be, and do not constitute, financial, investment, trading, or other types of advice or recommendations supplied or endorsed by TradingView. Read more in the Terms of Use.