Context – Structural Overview
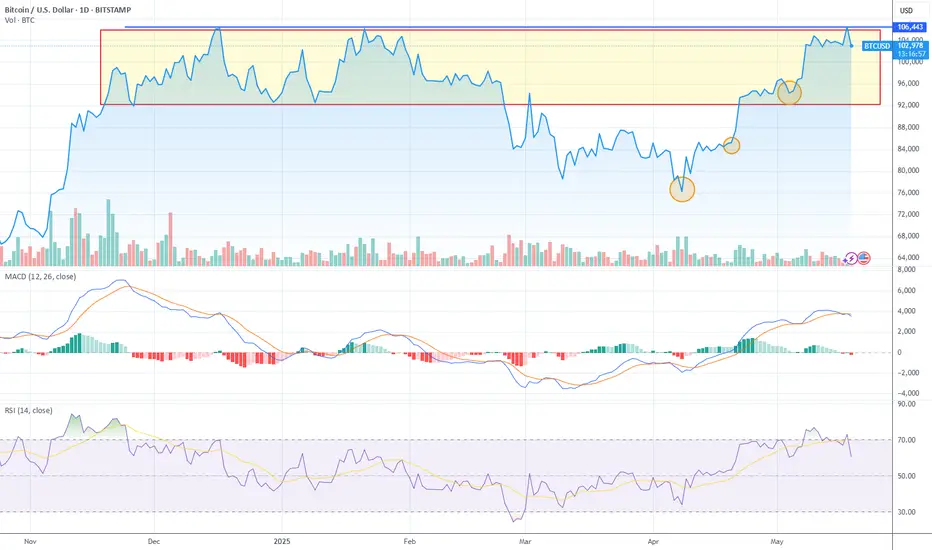
BTC has returned to its all-time high resistance zone ($103K–$106K). The yellow zone marks a multi-month consolidation range — we’ve now re-entered the top of that range, testing for breakout. This is the fifth test of supply, with bulls showing growing aggression, but now showing early signs of exhaustion.
Technical Breakdown
1. Price Action – Multi-Touch Resistance
BTC is pressing up against the same resistance zone that capped price for months. Each pullback has created a higher low (marked with circles) — a sign of accumulation and pressure build-up. But Friday’s candle shows rejection from the upper range, forming a possible short-term shooting star.
Key takeaway: Market is either coiling for a breakout… or setting a bull trap at major resistance.
2. Volume – Weak Breakout Follow-Through
Volume has not increased significantly on this recent breakout attempt — a red flag. The previous breakout attempt also failed on low volume. For a true breakout above $106K, we need to see a volume spike + strong candle body.
3. MACD – Bullish Momentum Slowing
MACD is still bullish, but the histogram is fading, suggesting momentum is weakening. No bearish crossover yet, but it’s flattening, indicating stall risk. If histogram turns red, expect consolidation or a potential pullback.
4. RSI – Rejected at Overbought Line
RSI tagged 70 and immediately reversed, failing to push into extreme bullish territory. Classic RSI rejection behavior at overbought levels — especially at key resistance. This adds weight to the idea of a short-term top or cool-off phase.
Fibonacci & Structural Context
This zone overlaps with previous all-time highs and top-side of consolidation. Technically, this is a Golden Pocket Zone for a bull breakout or failure. Macro crypto sentiment is bullish, ETF flows are strong, and institutional adoption is ongoing. However, BTC has rallied ~40%+ off March lows, and the market may need to shake out weak longs before pushing to new highs.
Conclusion – High-Stakes Zone, Leaning Short-Term Toppy
Bearish Case (most likely short-term scenario)
Failed breakout above $106K; RSI rejection + MACD slowing; No volume confirmation. Could trigger a pullback toward $96K– 92K support
Bearish Setup:
• Entry: below $102.5K
• Target: $96K, then92K
• Stop: above $106.5K
• Risk:Reward ~ 1:3
🚀 Bullish Case
Structure shows higher lows = ascending pressure
If BTC closes strong above $106K on high volume, the range is broken.
Next target = $114K–$120K
Bullish Setup:
• Entry: confirmed close > $106.5K
• Stop: under $102K
• Targets: $114K, then $120K+
Final Thought:
BTC is testing a multi-month ceiling with weak momentum, which often results in a short-term reversal or false breakout trap. But don’t fade it blindly — volume will confirm which way this breaks.
BTC has returned to its all-time high resistance zone ($103K–$106K). The yellow zone marks a multi-month consolidation range — we’ve now re-entered the top of that range, testing for breakout. This is the fifth test of supply, with bulls showing growing aggression, but now showing early signs of exhaustion.
Technical Breakdown
1. Price Action – Multi-Touch Resistance
BTC is pressing up against the same resistance zone that capped price for months. Each pullback has created a higher low (marked with circles) — a sign of accumulation and pressure build-up. But Friday’s candle shows rejection from the upper range, forming a possible short-term shooting star.
Key takeaway: Market is either coiling for a breakout… or setting a bull trap at major resistance.
2. Volume – Weak Breakout Follow-Through
Volume has not increased significantly on this recent breakout attempt — a red flag. The previous breakout attempt also failed on low volume. For a true breakout above $106K, we need to see a volume spike + strong candle body.
3. MACD – Bullish Momentum Slowing
MACD is still bullish, but the histogram is fading, suggesting momentum is weakening. No bearish crossover yet, but it’s flattening, indicating stall risk. If histogram turns red, expect consolidation or a potential pullback.
4. RSI – Rejected at Overbought Line
RSI tagged 70 and immediately reversed, failing to push into extreme bullish territory. Classic RSI rejection behavior at overbought levels — especially at key resistance. This adds weight to the idea of a short-term top or cool-off phase.
Fibonacci & Structural Context
This zone overlaps with previous all-time highs and top-side of consolidation. Technically, this is a Golden Pocket Zone for a bull breakout or failure. Macro crypto sentiment is bullish, ETF flows are strong, and institutional adoption is ongoing. However, BTC has rallied ~40%+ off March lows, and the market may need to shake out weak longs before pushing to new highs.
Conclusion – High-Stakes Zone, Leaning Short-Term Toppy
Bearish Case (most likely short-term scenario)
Failed breakout above $106K; RSI rejection + MACD slowing; No volume confirmation. Could trigger a pullback toward $96K–
Bearish Setup:
• Entry: below $102.5K
• Target: $96K, then
• Stop: above $106.5K
• Risk:Reward ~ 1:3
🚀 Bullish Case
Structure shows higher lows = ascending pressure
If BTC closes strong above $106K on high volume, the range is broken.
Next target = $114K–$120K
Bullish Setup:
• Entry: confirmed close > $106.5K
• Stop: under $102K
• Targets: $114K, then $120K+
Final Thought:
BTC is testing a multi-month ceiling with weak momentum, which often results in a short-term reversal or false breakout trap. But don’t fade it blindly — volume will confirm which way this breaks.
Disclaimer
The information and publications are not meant to be, and do not constitute, financial, investment, trading, or other types of advice or recommendations supplied or endorsed by TradingView. Read more in the Terms of Use.
Disclaimer
The information and publications are not meant to be, and do not constitute, financial, investment, trading, or other types of advice or recommendations supplied or endorsed by TradingView. Read more in the Terms of Use.