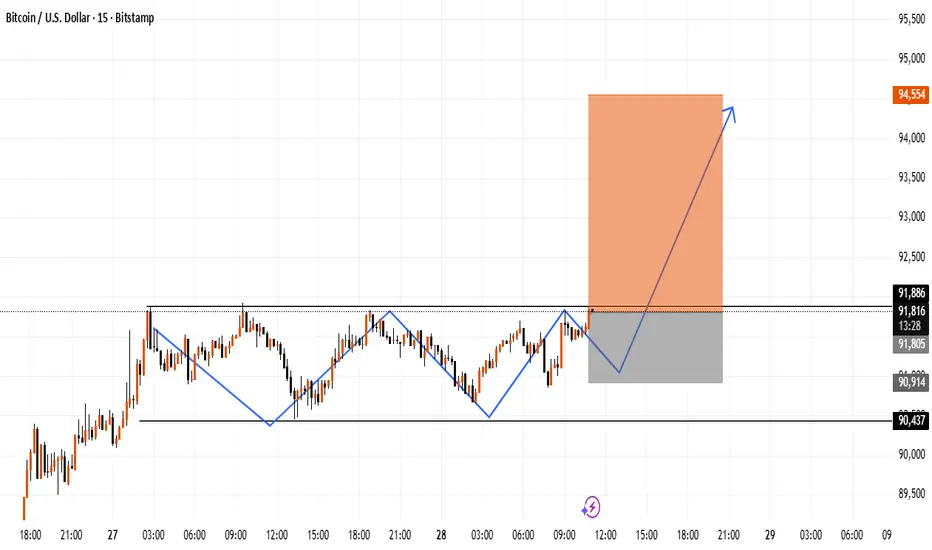
This chart highlights a short-term range on BTC where price has been reacting around the same horizontal zone multiple times. A clear internal structure shift can be seen, followed by a deeper pullback into the recent demand area. If price maintains support above this zone, it may open room for an upside continuation toward the next liquidity level.
The marked move is a possible price scenario, not a certainty.
This idea is shared for market observation and educational analysis only.
The marked move is a possible price scenario, not a certainty.
This idea is shared for market observation and educational analysis only.
Disclaimer
The information and publications are not meant to be, and do not constitute, financial, investment, trading, or other types of advice or recommendations supplied or endorsed by TradingView. Read more in the Terms of Use.
Disclaimer
The information and publications are not meant to be, and do not constitute, financial, investment, trading, or other types of advice or recommendations supplied or endorsed by TradingView. Read more in the Terms of Use.