Core Logic for Going Long: Three-Dimensional Resonance Lays the Foundation for Growth
1. Capital Aspect: ETF Outflows Near an End, with Solid Institutional Core Positions
Bitcoin spot ETFs recorded a net outflow of $2.7 billion in the past month, yet this only accounted for 1.5% of the total assets under management, with 98.5% of the capital remaining held. This indicates that the pressure from short-term capital outflows is drawing to a close. Judging from historical patterns, such a volatile growth trend featuring "two steps forward and one step back" is usually followed by capital inflows. Meanwhile, enterprises including MicroStrategy and Metaplanet keep increasing their Bitcoin holdings. BlackRock is expanding its spot ETF layout in Canada, and institutional demand for long-term allocation remains unabated, providing fundamental support for Bitcoin's price.
2. Macroeconomic Policies: Rate Cut Expectations Recover, Loose Liquidity on the Horizon
Although the Federal Reserve has implemented two consecutive interest rate cuts before and Powell released hawkish signals, the market still expects a 60% probability of another rate cut in December. Currently, inflation has fallen to 3.2%, creating room for further easing of monetary policy. Moreover, Bitcoin, with a high correlation coefficient of 0.77 with the Nasdaq 100 Index, will simultaneously benefit from the improvement in macro liquidity. In addition, expectations for crypto-friendly policies continue to build momentum, and the potential clarification of regulatory frameworks will further boost market confidence.
3. Technical Aspect: Oversold Rebound Signals Emerge, with Effective Support in the Volatile Range
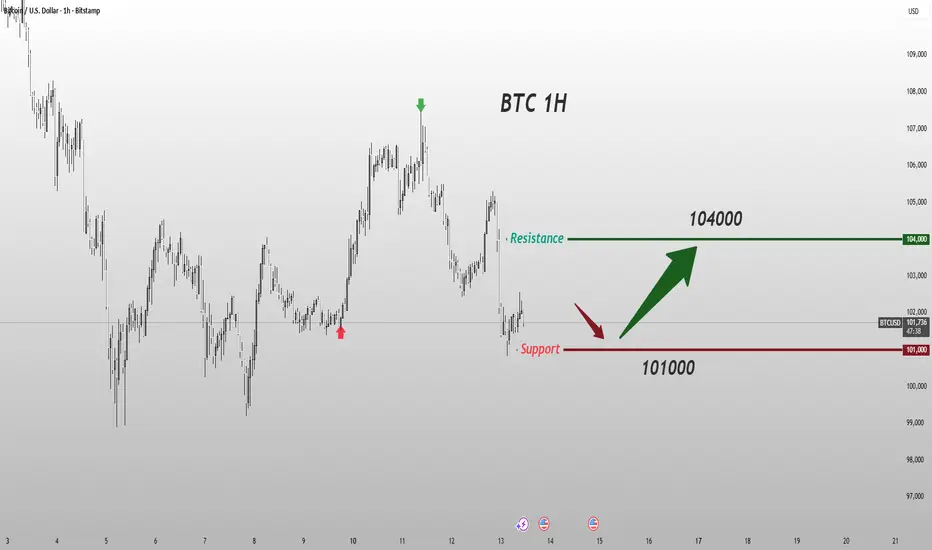
On the daily timeframe, Bitcoin has stabilized and rebounded above the $100,000 mark. The $102,100 level, located at the lower edge of the previous volatility mid-range, boasts strong support characteristics. The 4-hour chart shows that the price has returned to the middle band of the Bollinger Bands. The RSI indicator has recovered from the oversold zone, and the green bars of the MACD have been continuously narrowing, indicating a gradual exhaustion of bearish momentum. Meanwhile, although the 20-day, 50-day, and 100-day moving averages have formed a cluster of short-term resistance levels, the price gap between the current price and these resistance levels leaves ample room for speculation regarding a rebound.
Bitcoin trading strategy
buy:101000-102000
tp:103000-104000
sl:99500
1. Capital Aspect: ETF Outflows Near an End, with Solid Institutional Core Positions
Bitcoin spot ETFs recorded a net outflow of $2.7 billion in the past month, yet this only accounted for 1.5% of the total assets under management, with 98.5% of the capital remaining held. This indicates that the pressure from short-term capital outflows is drawing to a close. Judging from historical patterns, such a volatile growth trend featuring "two steps forward and one step back" is usually followed by capital inflows. Meanwhile, enterprises including MicroStrategy and Metaplanet keep increasing their Bitcoin holdings. BlackRock is expanding its spot ETF layout in Canada, and institutional demand for long-term allocation remains unabated, providing fundamental support for Bitcoin's price.
2. Macroeconomic Policies: Rate Cut Expectations Recover, Loose Liquidity on the Horizon
Although the Federal Reserve has implemented two consecutive interest rate cuts before and Powell released hawkish signals, the market still expects a 60% probability of another rate cut in December. Currently, inflation has fallen to 3.2%, creating room for further easing of monetary policy. Moreover, Bitcoin, with a high correlation coefficient of 0.77 with the Nasdaq 100 Index, will simultaneously benefit from the improvement in macro liquidity. In addition, expectations for crypto-friendly policies continue to build momentum, and the potential clarification of regulatory frameworks will further boost market confidence.
3. Technical Aspect: Oversold Rebound Signals Emerge, with Effective Support in the Volatile Range
On the daily timeframe, Bitcoin has stabilized and rebounded above the $100,000 mark. The $102,100 level, located at the lower edge of the previous volatility mid-range, boasts strong support characteristics. The 4-hour chart shows that the price has returned to the middle band of the Bollinger Bands. The RSI indicator has recovered from the oversold zone, and the green bars of the MACD have been continuously narrowing, indicating a gradual exhaustion of bearish momentum. Meanwhile, although the 20-day, 50-day, and 100-day moving averages have formed a cluster of short-term resistance levels, the price gap between the current price and these resistance levels leaves ample room for speculation regarding a rebound.
Bitcoin trading strategy
buy:101000-102000
tp:103000-104000
sl:99500
💎 Analysis strategy: Gold, crude oil, Bitcoin, foreign exchange, etc.
💎 Analysis of Important Events
💎 Free trading signals: t.me/+e1D3W7yOpLMzNTYx
💎 Analysis of Important Events
💎 Free trading signals: t.me/+e1D3W7yOpLMzNTYx
Disclaimer
The information and publications are not meant to be, and do not constitute, financial, investment, trading, or other types of advice or recommendations supplied or endorsed by TradingView. Read more in the Terms of Use.