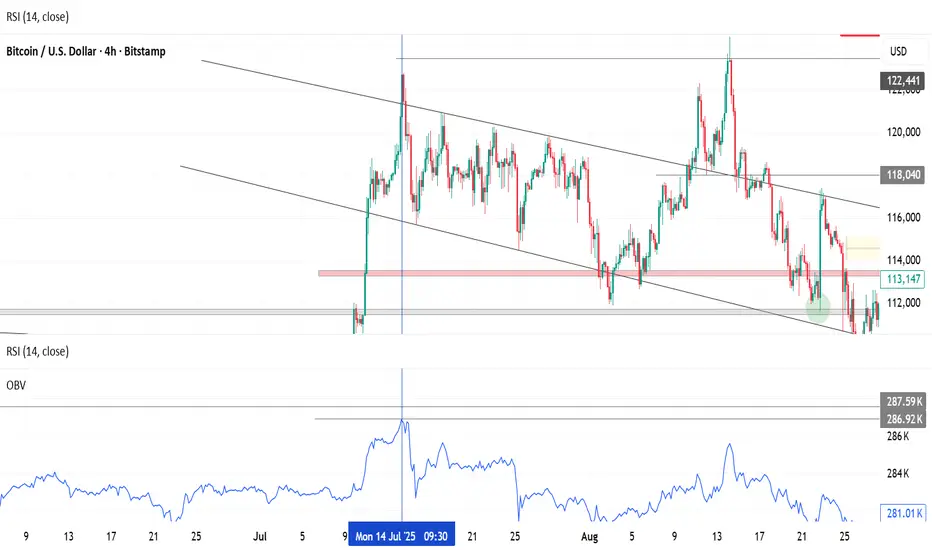
This 4-hour chart of Bitcoin (BTC/USD) highlights a breakout from a descending channel after a prolonged consolidation phase lasting over 16 days (99 bars).
🔻 A clearly defined supply zone (marked in red) acted as a major resistance area, rejecting price multiple times before the breakout. The breakout above this zone indicates a shift in market structure, with bullish momentum gaining strength.
🟡 The breakout was followed by sustained buying pressure, pushing BTC upwards toward the $118,000 region. Price has since pulled back slightly and is now hovering around $115,500 — retesting the previous resistance zone, now potentially acting as support
Disclaimer
The information and publications are not meant to be, and do not constitute, financial, investment, trading, or other types of advice or recommendations supplied or endorsed by TradingView. Read more in the Terms of Use.
Disclaimer
The information and publications are not meant to be, and do not constitute, financial, investment, trading, or other types of advice or recommendations supplied or endorsed by TradingView. Read more in the Terms of Use.