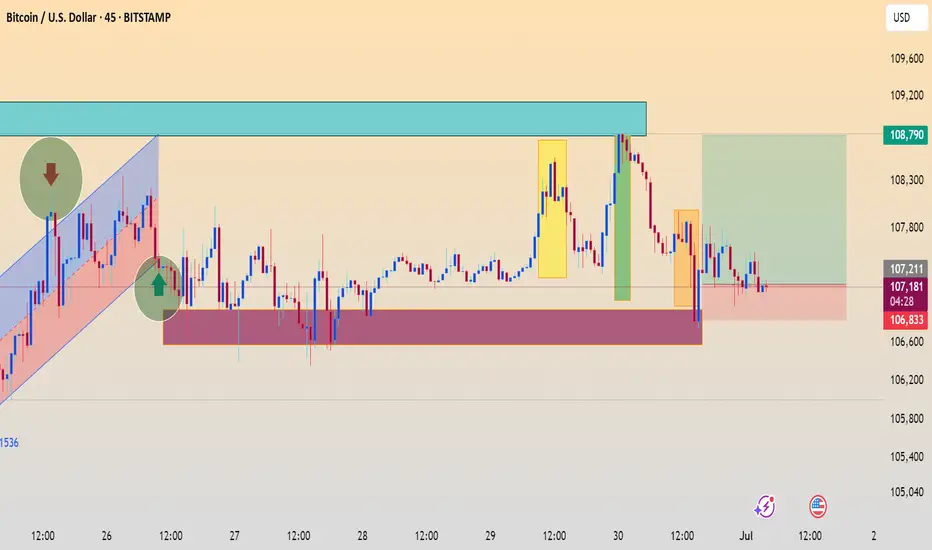
This chart shows Bitcoin (BTC/USD) on a 45-minute timeframe, with several key technical analysis elements marked:
Key Observations:
1. Trend Channel (Left side in red and blue):
The price was moving within a rising channel (bullish trend).
A breakout to the downside occurred, signaling a possible trend reversal.
2. Support Zone (Red shaded area):
Around the 106,600 to 107,200 range.
Price has tested this zone multiple times, showing strong demand/support.
3. Resistance Zone (Blue shaded area):
Roughly between 108,600 to 109,200.
Price was rejected from this area twice, showing significant selling pressure.
4. Highlighted Zones:
Green Rectangle: Successful bounce from the support area leading to a strong move upward.
Yellow Boxes: Impulsive bullish candles, signaling strong buying momentum.
Orange Box (Right): Bearish engulfing move, potentially showing exhaustion of bullish momentum.
Green and Red Arrows: Likely entry and exit signals.
Green arrow: Bullish entry at support.
Red arrow: Bearish entry at resistance.
5. Trade Setup:
A recent long position appears to have been initiated from the support zone, with a target near the upper resistance at 108,790.
The stop-loss seems to be below the support at around 106,833, and the entry around 107,122.
Summary:
The chart highlights a range-bound structure between the marked support and resistance zones.
A potential long trade is underway, targeting the upper resistance area.
Current price action is consolidating near support. A breakdown may invalidate the long setup, while a bounce could confirm a bullish move toward the 108,790 target.
Let me know if you’d like help calculating risk/reward or identifying the pattern names involved here.
Disclaimer
The information and publications are not meant to be, and do not constitute, financial, investment, trading, or other types of advice or recommendations supplied or endorsed by TradingView. Read more in the Terms of Use.
Disclaimer
The information and publications are not meant to be, and do not constitute, financial, investment, trading, or other types of advice or recommendations supplied or endorsed by TradingView. Read more in the Terms of Use.