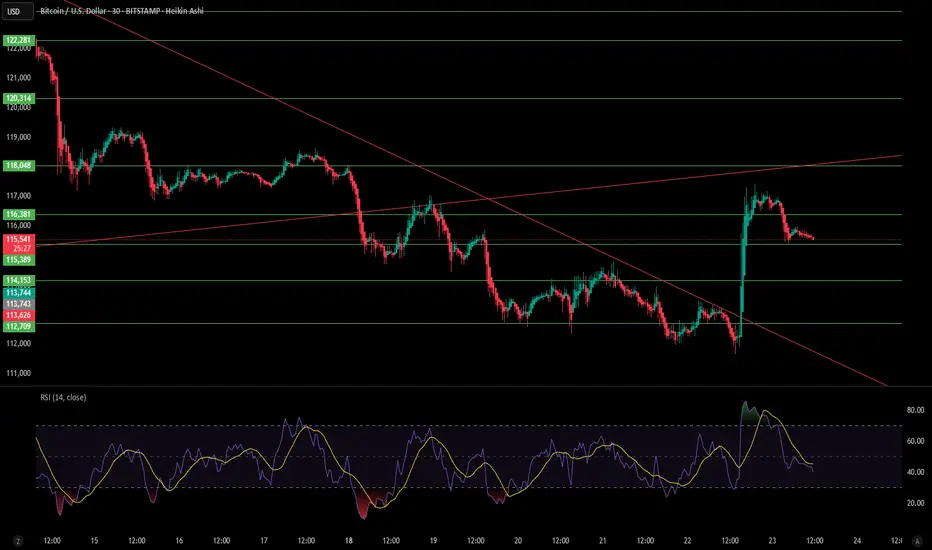
BTC is currently trading at $115,669 after a recovery bounce from the $112,700 support zone. Price recently broke above the descending trendline (red), signaling a potential shift in short-term momentum.
Key levels to watch:
🔴 Immediate Resistance: $116,000 – $116,380
🟢 Supports: $115,389 / $114,153 / $112,709
📈 Higher Resistance Zones: $118,048 / $120,314 / $123,273
The RSI (14) is currently at 55.96, slightly above neutral, suggesting BTC has room to move either direction without being overbought or oversold.
📌 Bullish Scenario: A break above $116,380 could open the way to retest $118,000 and possibly $120,000.
📌 Bearish Scenario: Rejection from current resistance may lead to a pullback toward $114,000 – $113,700, with deeper downside risk if $112,700 fails.
⚖️ Outlook: BTC is trying to regain bullish momentum after a recent downtrend. A decisive move above $116K will be crucial for further upside.
Disclaimer
The information and publications are not meant to be, and do not constitute, financial, investment, trading, or other types of advice or recommendations supplied or endorsed by TradingView. Read more in the Terms of Use.
Disclaimer
The information and publications are not meant to be, and do not constitute, financial, investment, trading, or other types of advice or recommendations supplied or endorsed by TradingView. Read more in the Terms of Use.