Bitcoin slid to around $108K during the previous week, as a mix of various events affected the value of the coin. It was a mix of technical sell signals, whale-driven liquidations, and ETF outflows, as well as liquidations through margin calls due to a dip in value. The decline marked a broader pullback across crypto markets, even despite sustained institutional interest in the sector. As per news reports, a high-profile investor (often referred to as a “whale”) reportedly offloaded a large amount of BTC, around 24,000 coins, which triggered widespread forced liquidations and sparked a sharp short-term drop in prices.
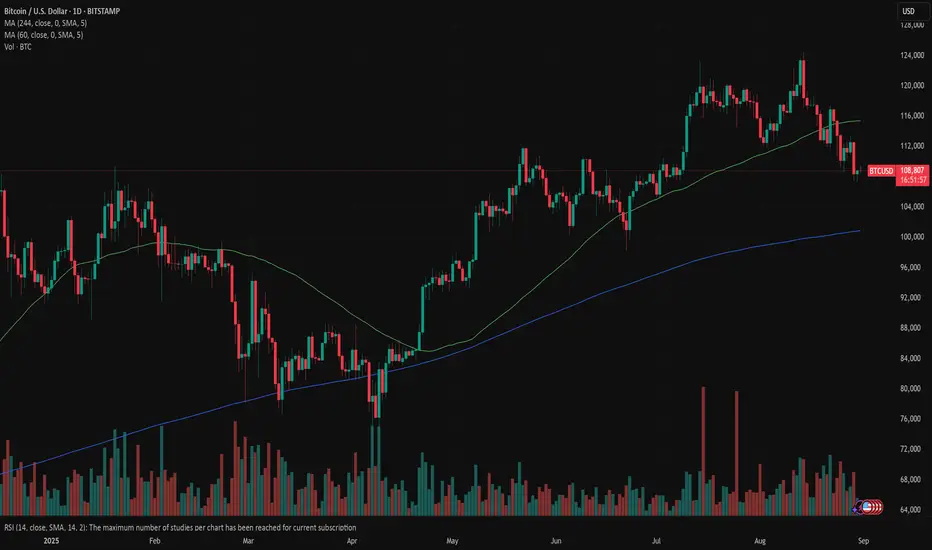
The lowest level of the coin was at Friday's trading session, at the level of $107,7K. Saturday's trading session brought some buyers of the coin, so BTC ended the week at $109K. The RSI reached the level of 38, while the clear oversold market side has not been reached. The MA50 is slowly starting to converge toward MA200, but the distance between lines is showing that the potential cross is still not on the horizon.
At this moment on charts, the crucial question is whether BTC finished its latest correction, which started after its new ATH was reached in mid-August. From the current point, charts are showing potential for a $105K support line. It would mark the highest level from January this year. On the opposite side, the latest strong push toward the downside, indicates a potential for a short price correction toward the upside. Currently, BTC is traded at $109K, with a potential for $111K to be tested.
Related publications
Disclaimer
The information and publications are not meant to be, and do not constitute, financial, investment, trading, or other types of advice or recommendations supplied or endorsed by TradingView. Read more in the Terms of Use.
Related publications
Disclaimer
The information and publications are not meant to be, and do not constitute, financial, investment, trading, or other types of advice or recommendations supplied or endorsed by TradingView. Read more in the Terms of Use.