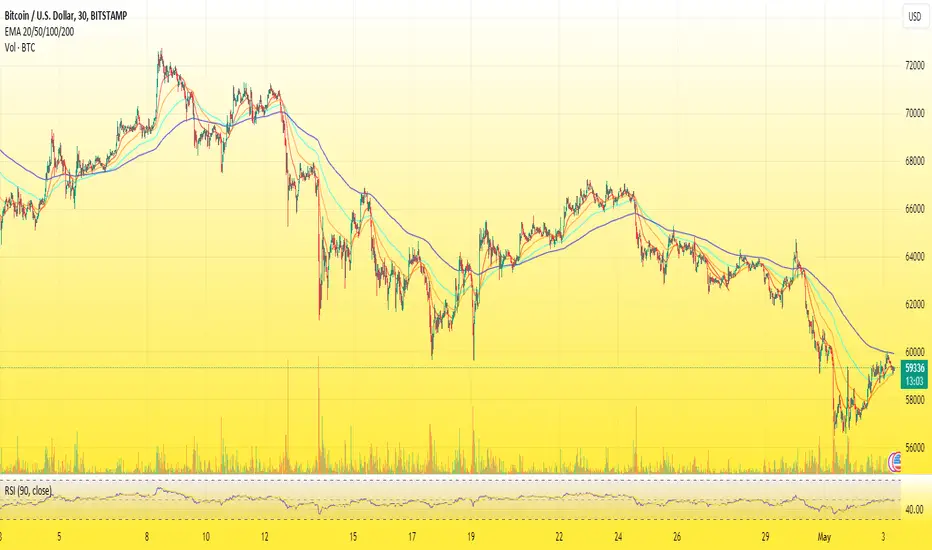
As we observe the BTC/USD chart on a 15-minute timeframe, several key indicators suggest a market poised for potential breakout:
- EMA Convergence: The EMA20 and EMA50 are closely aligned, indicating a consolidation phase. A breakout from this phase could set the direction for the next significant price movement.
- RSI Neutrality: The RSI stands at 52.57, reflecting a neutral market sentiment. Traders should watch for a break above 70 or below 30 to signal overbought or oversold conditions, respectively.
- Price Action: The recent decline followed by a partial recovery suggests a testing phase for the market. A sustained move above the recent high could confirm bullish momentum, while a drop below the recent low may signal further bearish pressure.
- Volume Analysis: While not visible in the chart description, volume will be a critical factor to confirm any breakout. An increase in volume during a price move indicates stronger conviction among traders.
- Potential Breakout Levels:
- Upside: Watch for a sustained move above the recent high at $59,586, which could open the path towards $60,000 psychological resistance.
- Downside: A break below the recent low at $59,583 may lead to a test of the $59,200 support zone.
Traders should keep an eye on these indicators and be prepared to act on confirmed breakout signals.
Disclaimer
The information and publications are not meant to be, and do not constitute, financial, investment, trading, or other types of advice or recommendations supplied or endorsed by TradingView. Read more in the Terms of Use.
Disclaimer
The information and publications are not meant to be, and do not constitute, financial, investment, trading, or other types of advice or recommendations supplied or endorsed by TradingView. Read more in the Terms of Use.