Ok, don't think this is about Bitcoin. This is just a good use case for these types of tools. All of which you can find for free here on TradingView
People tend to not really understand some of these tools, maybe they get the idea but not the real value.
For a long time, I used to trade footprint charts, volume delta and seeking more and more info. Now if you don't know what a footprint chart is, don't stress. Footprints are like looking inside a candlestick, it gives you both the buys and sells of each candle. That's about as much as you need to know.
So why don't everyone use them? that is a complex question to answer, but in simple terms. There is no need.
By following rule based techniques such as the mechanical trading system I shared in recent posts;

Ok, so let me show you something.
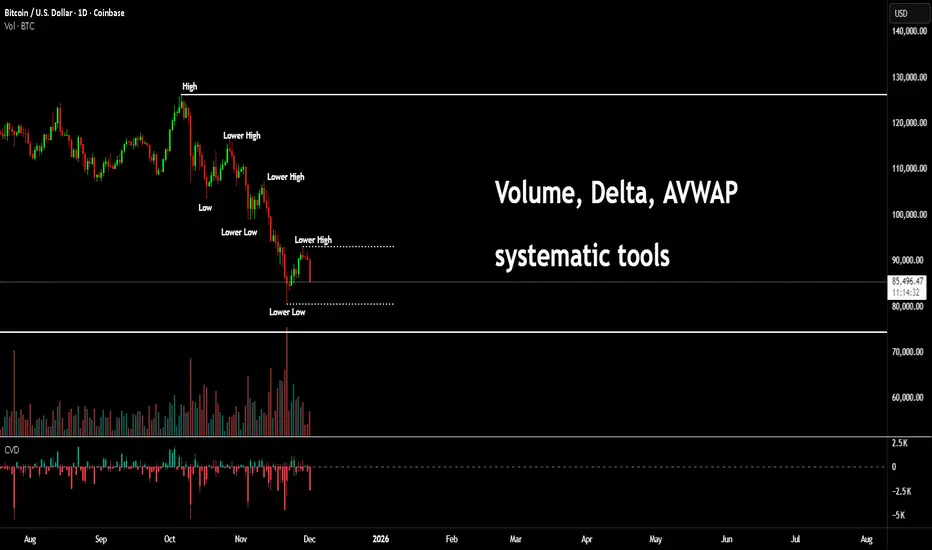
Take the simple volume tool (I have also added a CVD) more on this later. But with a quick glance, we can spot the price rising and volume dropping off. This is called Divergence.

As you can see price then carries on up and the volume and CVD tools start printing a different story.

Again, not an attack on Bitcoin (I know how precious and defensive some of you get).
This is for any instrument.
Here's another little technique; there is a pattern known as a master pattern. It's a dumbed down Wyckoff. But basically after accumulation or distribution, you see an expansion phase. This is often called a UTAD or a spring (depending on the direction)

I have shown this with the PoC as the main auction area. The consolidation - also known as fair value is an area where a lot of buying and selling took place.

After expanding to roughly equal distances either side of the consolidation. The price will test the PoC or middle of the auction zone again.
However, where people fail to see the obvious. IS as simple as understanding the CVD and volume story.

We could add other tools such as the AVWAP.

You can see price rotates around the auction area. Zoom out;

Here we see price drop below the blue "Value area" meaning it has dropped and is likely to rotate back to the underside of the above auction area. This we can say is a re-test.
So, let's assume we rise - obviously buyers will be buying the dip. After a retest. There are even more clues as to where price will seek liquidity. For this, see the volume profile.

Now, lets add another technique. This is known as internal and external liquidity. We took out prior bullish liquidity (external) then moved back internal. Price will likely seek the next leg higher, but remain internal. All before seeking external, Bearish liquidity.

Here's a simple picture of highs and lows that turn into lower highs and lower lows.

To get a clear read on this; we will need the price to break one of these two levels. Once we do, we have confirmation and a bias as to what pool of liquidity will go after next.

But...
Is there something that gives an early clue?
Well yes. Look at the CVD.

You see, this doesn't have to be all that complicated. Market will seek liquidity, markets don't push up and up forever. There's a saying in this space, if you can't spot liquidity, then you are the liquidity.
Stay safe all!
Disclaimer
This idea does not constitute as financial advice. It is for educational purposes only, our principal trader has over 25 years' experience in stocks, ETF's, and Forex. Hence each trade setup might have different hold times, entry or exit conditions, and will vary from the post/idea shared here. You can use the information from this post to make your own trading plan for the instrument discussed. Trading carries a risk; a high percentage of retail traders lose money. Please keep this in mind when entering any trade. Stay safe.
People tend to not really understand some of these tools, maybe they get the idea but not the real value.
For a long time, I used to trade footprint charts, volume delta and seeking more and more info. Now if you don't know what a footprint chart is, don't stress. Footprints are like looking inside a candlestick, it gives you both the buys and sells of each candle. That's about as much as you need to know.
So why don't everyone use them? that is a complex question to answer, but in simple terms. There is no need.
By following rule based techniques such as the mechanical trading system I shared in recent posts;
Ok, so let me show you something.
Take the simple volume tool (I have also added a CVD) more on this later. But with a quick glance, we can spot the price rising and volume dropping off. This is called Divergence.
As you can see price then carries on up and the volume and CVD tools start printing a different story.
Again, not an attack on Bitcoin (I know how precious and defensive some of you get).
This is for any instrument.
Here's another little technique; there is a pattern known as a master pattern. It's a dumbed down Wyckoff. But basically after accumulation or distribution, you see an expansion phase. This is often called a UTAD or a spring (depending on the direction)
I have shown this with the PoC as the main auction area. The consolidation - also known as fair value is an area where a lot of buying and selling took place.
After expanding to roughly equal distances either side of the consolidation. The price will test the PoC or middle of the auction zone again.
However, where people fail to see the obvious. IS as simple as understanding the CVD and volume story.
We could add other tools such as the AVWAP.
You can see price rotates around the auction area. Zoom out;
Here we see price drop below the blue "Value area" meaning it has dropped and is likely to rotate back to the underside of the above auction area. This we can say is a re-test.
So, let's assume we rise - obviously buyers will be buying the dip. After a retest. There are even more clues as to where price will seek liquidity. For this, see the volume profile.
Now, lets add another technique. This is known as internal and external liquidity. We took out prior bullish liquidity (external) then moved back internal. Price will likely seek the next leg higher, but remain internal. All before seeking external, Bearish liquidity.
Here's a simple picture of highs and lows that turn into lower highs and lower lows.
To get a clear read on this; we will need the price to break one of these two levels. Once we do, we have confirmation and a bias as to what pool of liquidity will go after next.
But...
Is there something that gives an early clue?
Well yes. Look at the CVD.
You see, this doesn't have to be all that complicated. Market will seek liquidity, markets don't push up and up forever. There's a saying in this space, if you can't spot liquidity, then you are the liquidity.
Stay safe all!
Disclaimer
This idea does not constitute as financial advice. It is for educational purposes only, our principal trader has over 25 years' experience in stocks, ETF's, and Forex. Hence each trade setup might have different hold times, entry or exit conditions, and will vary from the post/idea shared here. You can use the information from this post to make your own trading plan for the instrument discussed. Trading carries a risk; a high percentage of retail traders lose money. Please keep this in mind when entering any trade. Stay safe.
Discord Server for education and advanced techniques: discord.gg/5t3w47raHe
Masterclass Webinar: mayfairtradingevents.com
Prop firm partners (FTMO)
shorturl.at/hBEQ4
Masterclass Webinar: mayfairtradingevents.com
Prop firm partners (FTMO)
shorturl.at/hBEQ4
Related publications
Disclaimer
The information and publications are not meant to be, and do not constitute, financial, investment, trading, or other types of advice or recommendations supplied or endorsed by TradingView. Read more in the Terms of Use.