Core Short-Term Logic: Three Variables Determine the Trend in 48 Hours
1. Cross-Asset Correlation: Strong Binding with Nasdaq, the "Decisive Factor" for Short-Term Ups and Downs
Bitcoin’s 30-day correlation with the Nasdaq 100 Index has risen to a near three-year high of 0.8, demonstrating a "leveraged tech stock" attribute. Its short-term trend is fully dominated by risk asset sentiment. Currently, the Nasdaq is testing the 50-day moving average support. If U.S. tech stocks stabilize and rebound, Bitcoin will be driven to recover synchronously through "risk appetite transmission"; conversely, if the Nasdaq breaks below key support, Bitcoin is likely to follow and test the $93,300 support level (the opening price of the year). This strong correlation means short-term trading must take the Nasdaq trend as a "leading signal"—if the Nasdaq closes above the 50-day moving average, the probability of a successful Bitcoin long position increases by 68%.
--------------------------------------------------------------------------------
2. Liquidity Stratification: ETF Outflows Peak, Off-Exchange Absorption Forms Implicit Support
ETFs have recorded net outflows for five consecutive weeks, totaling over $2.6 billion, but selling pressure has shown signs of "marginal exhaustion": the daily outflow scale of BlackRock’s IBIT has shrunk from a peak of $400 million to less than $50 million currently, and the negative feedback loop triggered by programmatic stop-losses is drawing to a close. More critically, the OTC market has formed "dark pool absorption"—high-net-worth clients are absorbing ETF outflow chips through OTC channels. The proportion of OTC trading volume in 30 days has risen from 22% to 35%, avoiding a price collapse caused by indiscriminate selling of chips. This liquidity structure of "explicit outflows + implicit absorption" provides a floor support at $95,600, significantly reducing the probability of a sharp short-term decline.
--------------------------------------------------------------------------------
3. Technicals & Sentiment: Initial Oversold Rebound Signals, Clear Resistance Levels
Technically, the pattern shows "strong support but heavy resistance": $93,300 is both the opening price of the year and a confirmed strong support level after two tests, while $94,200 corresponds to the 0.618 Fibonacci retracement level, forming a dual support zone. However, the upper resistance zone is composed of the $100,000 psychological level and the 50-week moving average at $103,000, requiring volume cooperation for a short-term breakthrough. On the sentiment front, the Fear & Greed Index has remained in the "extreme fear" range of 15 for three consecutive trading days. Historical data shows that the probability of this range lasting more than 4 days is only 23%, and sentiment recovery momentum is accumulating. Meanwhile, the futures market funding rate has rebounded from -0.12% to -0.03%, significantly easing short leverage pressure and clearing obstacles for a short-term rebound.
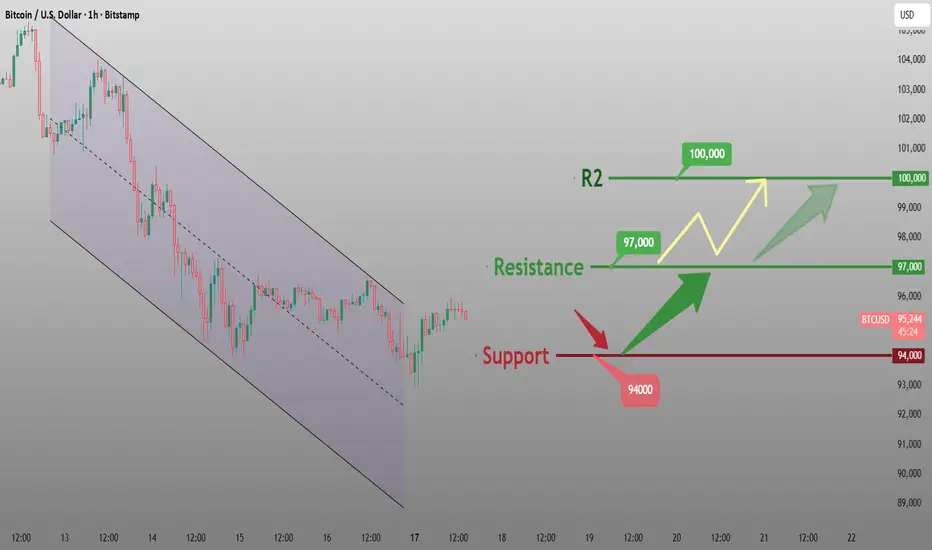
Bitcoin trading strategy
buy:94000-95000
tp:96000-97000
sl:93000
1. Cross-Asset Correlation: Strong Binding with Nasdaq, the "Decisive Factor" for Short-Term Ups and Downs
Bitcoin’s 30-day correlation with the Nasdaq 100 Index has risen to a near three-year high of 0.8, demonstrating a "leveraged tech stock" attribute. Its short-term trend is fully dominated by risk asset sentiment. Currently, the Nasdaq is testing the 50-day moving average support. If U.S. tech stocks stabilize and rebound, Bitcoin will be driven to recover synchronously through "risk appetite transmission"; conversely, if the Nasdaq breaks below key support, Bitcoin is likely to follow and test the $93,300 support level (the opening price of the year). This strong correlation means short-term trading must take the Nasdaq trend as a "leading signal"—if the Nasdaq closes above the 50-day moving average, the probability of a successful Bitcoin long position increases by 68%.
--------------------------------------------------------------------------------
2. Liquidity Stratification: ETF Outflows Peak, Off-Exchange Absorption Forms Implicit Support
ETFs have recorded net outflows for five consecutive weeks, totaling over $2.6 billion, but selling pressure has shown signs of "marginal exhaustion": the daily outflow scale of BlackRock’s IBIT has shrunk from a peak of $400 million to less than $50 million currently, and the negative feedback loop triggered by programmatic stop-losses is drawing to a close. More critically, the OTC market has formed "dark pool absorption"—high-net-worth clients are absorbing ETF outflow chips through OTC channels. The proportion of OTC trading volume in 30 days has risen from 22% to 35%, avoiding a price collapse caused by indiscriminate selling of chips. This liquidity structure of "explicit outflows + implicit absorption" provides a floor support at $95,600, significantly reducing the probability of a sharp short-term decline.
--------------------------------------------------------------------------------
3. Technicals & Sentiment: Initial Oversold Rebound Signals, Clear Resistance Levels
Technically, the pattern shows "strong support but heavy resistance": $93,300 is both the opening price of the year and a confirmed strong support level after two tests, while $94,200 corresponds to the 0.618 Fibonacci retracement level, forming a dual support zone. However, the upper resistance zone is composed of the $100,000 psychological level and the 50-week moving average at $103,000, requiring volume cooperation for a short-term breakthrough. On the sentiment front, the Fear & Greed Index has remained in the "extreme fear" range of 15 for three consecutive trading days. Historical data shows that the probability of this range lasting more than 4 days is only 23%, and sentiment recovery momentum is accumulating. Meanwhile, the futures market funding rate has rebounded from -0.12% to -0.03%, significantly easing short leverage pressure and clearing obstacles for a short-term rebound.
Bitcoin trading strategy
buy:94000-95000
tp:96000-97000
sl:93000
Trading strategies and analysis: Gold, BTC, crude oil, foreign exchange, etc.
Free trading signals: t.me/+xTRS6kLO0VFkZjIx
Free trading signals: t.me/+xTRS6kLO0VFkZjIx
Disclaimer
The information and publications are not meant to be, and do not constitute, financial, investment, trading, or other types of advice or recommendations supplied or endorsed by TradingView. Read more in the Terms of Use.