Even I don’t believe this, not for a minute. However, facts of the chart are telling.. and its spooky. Mulder level spooky. Very simple reasoning:
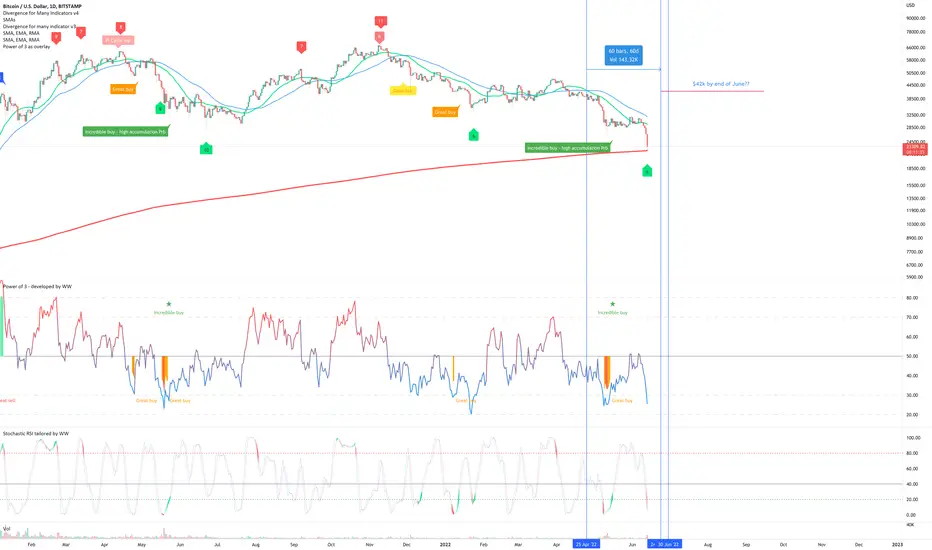
1) The 26-day EMA (green line) crosses down the 50-day SMA (blue line).
2) Price action falls to the 200-week moving average.
3) That’s it. We’re call this the ‘cross down’.
First we have 2015 / 60 days to recover to the same price action at the point of the cross down.

Second we have 2018/19 @ 227 days to recover to cross down point. This one if different to the others in that it followed a cycle top that touched the upper log growth curve. The others did not.

Third we have 2020 / 60 days to recover to cross down point

Lastly we have the current cross down that is currently 49 days into the pattern.
Take this idea with a large pinch of salt. I’ve no idea how, but if we look left, the facts of the chart are undeniable.
WW
PS: If this turns out to be true I'm expecting 'master of the charts' status !!
1) The 26-day EMA (green line) crosses down the 50-day SMA (blue line).
2) Price action falls to the 200-week moving average.
3) That’s it. We’re call this the ‘cross down’.
First we have 2015 / 60 days to recover to the same price action at the point of the cross down.
Second we have 2018/19 @ 227 days to recover to cross down point. This one if different to the others in that it followed a cycle top that touched the upper log growth curve. The others did not.
Third we have 2020 / 60 days to recover to cross down point
Lastly we have the current cross down that is currently 49 days into the pattern.
Take this idea with a large pinch of salt. I’ve no idea how, but if we look left, the facts of the chart are undeniable.
WW
PS: If this turns out to be true I'm expecting 'master of the charts' status !!
Note
Price action is about to move to the $24.5k to $25k area. This will start the FOMO of those looking up waiting for the $12k, $19k, $20k limit orders to fill. Folks, timing the market doesn't work.Note
Please be careful if you're playing with 'short' positions at the moment as they approach resistance. The last two events (purple circles) saw mass liquidations. Growing tired of the folks in touch saying the lost 'everything' playing with futures please help. Folks, stay away from leverage! Spot only.Note
Are we about to see a leap back up to $28k?On the 4hour chart there's a notable bullish divergence printing following a breakout from the wedge with the flagpole extension taking price action back to past support.
Note
This is a good level of capitulation we’re seeing. On the 2-day charts price action is 25% outside the Bollinger Band since exiting at $25k.To provide some insight as to how bearish and scared the market is right now, is the pandemic lows in March 2020 was 30% outside the Band. 7 days later it had returned to the exit point.
Note
Seen a couple of hundred million dollars worth get picked up today, no whale is chasing. Just sit there with a limit order while the fear fills the orders. Note
$22.5k will be the first resistance test.Note
Got until the end of this week if the 60 day statistic is going to hold. Can’t even imagine a 105% move in the next 4-days. Have read through my own idea, verified the data, it stacks up. Of course it can always be different this time, but make not mistake it will return to the cross down point even if not by this weekend.Continuing to look at the daily chart below, that’s a chart I’d buy every day of the week and twice on Sunday. The ‘incredible buy’ signal has yet to confirm. Although has confirmed on the 15hr chart with bullish divergence.
What could possibly push price action up by 105% in 4 days to maintain this 60-day statistic. One thing and only only one… a short squeeze.
Lets wait and see..
Daily chart
15 hour chart
Note
Just a little over 24 hours for Bitcoin price action to increase 100% to maintain this statistic, I don't think so!!It worth pointing out a second 'incredible buy' signal has appeared. 2x 'incredible buy' signals have not appeared that close together since late 2019. A 50% rally followed.
Note
Price action is being squeezed into an ever tighter trading zone. Once way or another it must break up or down before Saturday 16:00 CET. Either way, it is likely to be a large move.Note
Pi-cycle bottom just printed on the 8hr chartThe last time this happened on the 8hr was July 15th, 2021. A 60% move followed:
Trade closed manually
Obviously not going to happen, give it another month.The 'pi-cycle' bottoms are creeping further up the time frames. Last I saw it, it was on the 8hr now it is printing on the 22hr chart. Will print on the daily very soon.
Note
Although this thread is closed I thought it be interesting to point out:1) The theory of the idea remain intact just not the date. The target price is unchanged.
2) The inverse head and shoulders pattern as identified on the 1-day chart below is actually more powerful on Stochastic RSI than it is on price action. It is telling you there is about to be a leap in momentum. You don’t often see them but when you do… don’t sit on your hands! This inverse head and shoulders is larger than the last. The way to think about this… You know what a slingshot is? This is pulled back further than the previous.
Note
Although this idea is closed, the premise behind it remains valid, especially when you take the correction from 2019. Copy the 2019 correction and lay it on top of current, remarkable fractal isn't it?This fractal suggests $30k at least by the end of the month.
Note
Remember this idea??Reviewing just... just because. The same moving averages discussed in the original post suggest price action will be the mid-$30k area before mid-September, possibly the next 2 weeks. Who knows..
Note
GRM support is confirmed.Hold until 37k in November where the next resistance is.
Disclaimer
The information and publications are not meant to be, and do not constitute, financial, investment, trading, or other types of advice or recommendations supplied or endorsed by TradingView. Read more in the Terms of Use.
Disclaimer
The information and publications are not meant to be, and do not constitute, financial, investment, trading, or other types of advice or recommendations supplied or endorsed by TradingView. Read more in the Terms of Use.