I believe that it is possible to beat the market through a consistent and unemotional approach. This is primarily achieved through preparing instead of reacting. Click here to learn more about how I use the indicators below and Click here to get my complete trading strategy! Please be advised that I swing trade and will often hold onto a position for > 1 month. What you do with your $ is your business, what I do with my $ is my business.
My recent Bitcoin Bubble Comparison - 3 Day Chart led to the following calls: < $5,750 by 11/15/2018 & my prediction for the bottom is $2,718 by 1/20/19 | My Bitcoin Bubble Comparison - Monthly Chart closely mirrored my price and time targets | Calling for $35 ETH before the end of 2018.
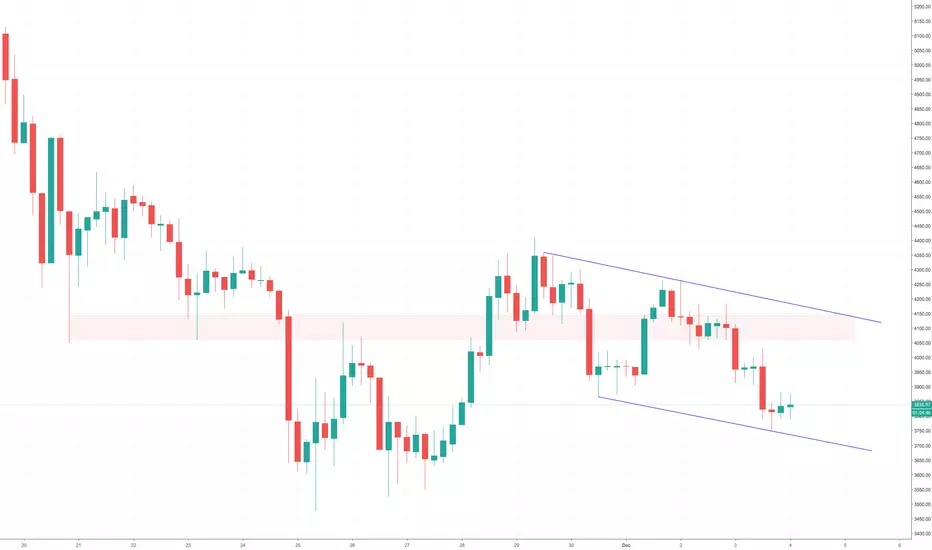
Previous analysis: “I like the risk reward of a long in that area [$3,750].”
Position: Short ETH:BTC 0.03109 | Short EOS:BTC from 0.0008057 | Short XRPBTC from 0.00009434 | Long LTCBTC from 0.00812 | Long BTC:USD from $3,751
Patterns: 4h is starting a new downtrend
Horizontal support and resistance: S: $3,732 | R: $3,886
BTCUSDSHORTS: Closed above downtrend but with a bearish wick
Funding Rates: Longs receive 0.0996%
Short term trend (4 day MA): Close below and trending down
Medium term trend (9 day MA): CLose below and getting a bearish cross with 4 MA
Long term trend ( 34 day MA): Trending down, should be strong resistance on a retest
Overall trend: Bearish
Volume: More selling volume than buying volume last two days
FIB’s: (Using top of Nov 12th and bottom of Nov 25th) 0.786 = $4,056 | 0.618 = $4,558 | 0.5 = $4,909
Candlestick analysis: Confirmed bearish doji
Ichimoku Cloud: 4h shows big resistance from $4,000 - $4,800
TD’ Sequential: We did get a perfected r9 (4h) in the buy zone I lined out.
Visible Range: High volume node from $4,000 - $4,600 holding as resistance
Price action: 24h: -2.75%
Bollinger Bands: Pulling back before testing the MA
Trendline: Didn’t retest the trendline and now there isn’t room for that without taking out the lows from Nov 25
Daily Trend: (Using 1h 33 MA to identify daily trend) Bearish
Parabolic SAR: $3,522
RSI: Retesting 30
Stochastic: Bullish recross
Last Day Rule: November 29th’s high ($4,414) is proving a difficult area to retest for the trigger day
Summary: Yesterday I was really liking the risk:reward on a long. Viewing $3,500 - $3,750 as a strong area of support and using the daily parabolic SAR as I stop. I wanted to see a strong bounce from there on large volume.
If that happened then I likely would have added a little to my small long. Instead we appear to be creating a new bear trend and I am feeling skittish. I moved my stop to breakeven well before my guidelines suggest.
However, there are always a few things that are more important than where the parabolic SAR is. Any guesses?
Risk management and betting with the trend.
I’m comfortable betting against the trend when the risk:reward is weighted heavily enough in my favor. However, I will also be tighter with my stop losses than I would like to be on a regular basis.
My recent Bitcoin Bubble Comparison - 3 Day Chart led to the following calls: < $5,750 by 11/15/2018 & my prediction for the bottom is $2,718 by 1/20/19 | My Bitcoin Bubble Comparison - Monthly Chart closely mirrored my price and time targets | Calling for $35 ETH before the end of 2018.
Previous analysis: “I like the risk reward of a long in that area [$3,750].”
Position: Short ETH:BTC 0.03109 | Short EOS:BTC from 0.0008057 | Short XRPBTC from 0.00009434 | Long LTCBTC from 0.00812 | Long BTC:USD from $3,751
Patterns: 4h is starting a new downtrend
Horizontal support and resistance: S: $3,732 | R: $3,886
BTCUSDSHORTS: Closed above downtrend but with a bearish wick
Funding Rates: Longs receive 0.0996%
Short term trend (4 day MA): Close below and trending down
Medium term trend (9 day MA): CLose below and getting a bearish cross with 4 MA
Long term trend ( 34 day MA): Trending down, should be strong resistance on a retest
Overall trend: Bearish
Volume: More selling volume than buying volume last two days
FIB’s: (Using top of Nov 12th and bottom of Nov 25th) 0.786 = $4,056 | 0.618 = $4,558 | 0.5 = $4,909
Candlestick analysis: Confirmed bearish doji
Ichimoku Cloud: 4h shows big resistance from $4,000 - $4,800
TD’ Sequential: We did get a perfected r9 (4h) in the buy zone I lined out.
Visible Range: High volume node from $4,000 - $4,600 holding as resistance
Price action: 24h: -2.75%
Bollinger Bands: Pulling back before testing the MA
Trendline: Didn’t retest the trendline and now there isn’t room for that without taking out the lows from Nov 25
Daily Trend: (Using 1h 33 MA to identify daily trend) Bearish
Parabolic SAR: $3,522
RSI: Retesting 30
Stochastic: Bullish recross
Last Day Rule: November 29th’s high ($4,414) is proving a difficult area to retest for the trigger day
Summary: Yesterday I was really liking the risk:reward on a long. Viewing $3,500 - $3,750 as a strong area of support and using the daily parabolic SAR as I stop. I wanted to see a strong bounce from there on large volume.
If that happened then I likely would have added a little to my small long. Instead we appear to be creating a new bear trend and I am feeling skittish. I moved my stop to breakeven well before my guidelines suggest.
However, there are always a few things that are more important than where the parabolic SAR is. Any guesses?
Risk management and betting with the trend.
I’m comfortable betting against the trend when the risk:reward is weighted heavily enough in my favor. However, I will also be tighter with my stop losses than I would like to be on a regular basis.
emasar Indicator is available for purchase at alphanalysis.io/product/emasar/
Disclaimer
The information and publications are not meant to be, and do not constitute, financial, investment, trading, or other types of advice or recommendations supplied or endorsed by TradingView. Read more in the Terms of Use.