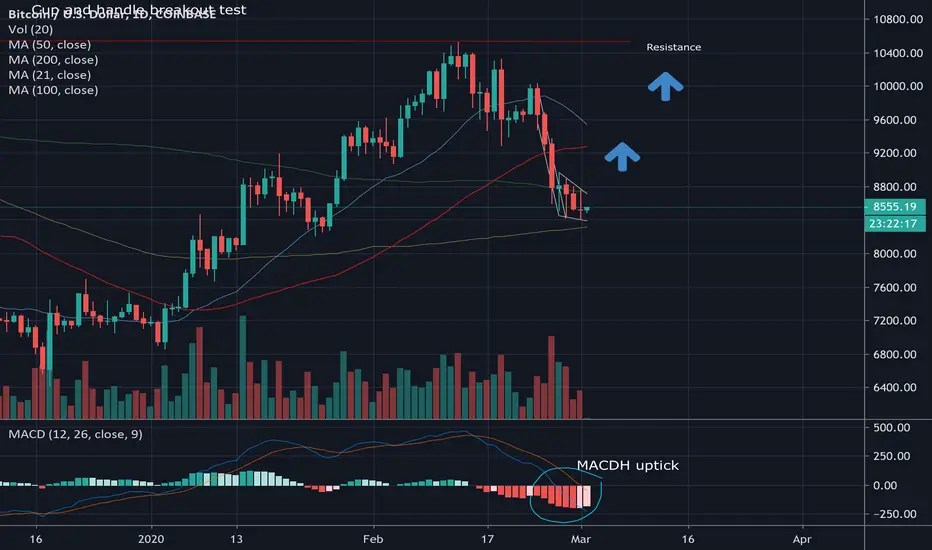
Bitcoin has just put in a bullish gravestone doji candle on the daily chart, which is a bullish indicator especially as prices are so oversold and trading underneath the 200DMA after a golden cross. In addition we can see a falling wedge on the charts (see 4 hour) which indicates a reversal is coming, some might even say a double bottom. I wouldn't be surprised to see a strong divergence on the 4hr MACD histogram too in the next few hours, one of the most powerful reversal signals.
Target is the resistance of 10,500 (cup and handle formation). Stop at the daily low around 8400.
Please like and follow if you agree, for more ideas and updates:)
Target is the resistance of 10,500 (cup and handle formation). Stop at the daily low around 8400.
Please like and follow if you agree, for more ideas and updates:)
Disclaimer
The information and publications are not meant to be, and do not constitute, financial, investment, trading, or other types of advice or recommendations supplied or endorsed by TradingView. Read more in the Terms of Use.
Disclaimer
The information and publications are not meant to be, and do not constitute, financial, investment, trading, or other types of advice or recommendations supplied or endorsed by TradingView. Read more in the Terms of Use.