1.Macroeconomic Expectations: Expectation Gap Opportunities Amid Rate Cut Games
The expectation for the Federal Reserve's December rate cut is characterized by "hidden support amid divergences". Although data from the CME FedWatch Tool showed that the probability of a 25BP rate cut dropped to 44.4%, this downward trend has been offset by two key factors. On one hand, Kevin Hassett, a White House official and a front - runner for the next Fed chair, publicly voiced his support for unconventional rate cuts, stating that there is substantial room for sharp interest rate reductions given the current economic data. On the other hand, former President Trump has been exerting constant policy pressure on the Federal Reserve. These two forces combined have prevented the market's expectation for a dovish policy guideline from fading away.
The fundamental support for the Fed's potential easing lies in the weakness of the U.S. economic fundamentals, especially the deteriorating labor market. In November, the ADP employment figure decreased by 32,000, and the number of layoffs soared by 183%. Such obvious signs of a sluggish labor market have provided solid realistic grounds for the Federal Reserve to implement loose monetary policies. It has become a preventive measure for the Fed to cut interest rates to avoid the spillover of the labor market's weakness to consumption and overall economic growth.
Additionally, Bitcoin and the U.S. dollar index maintain a strong negative correlation of -0.72. As the logic of the Fed's easing policy continues to take shape, the U.S. dollar is likely to weaken further. This inherent correlation has reserved sufficient room for Bitcoin's rebound after the dollar weakens. Currently, Bitcoin's price of $90,300 has already partially absorbed the risk of a less - than - expected rate cut. Looking ahead, the repair of the expectation gap, which comes from the possible alignment between the Fed's future policy moves and the market's dovish expectations, will become the core driving force for bullish positions in Bitcoin.
2. Technical Structure: At the End of Range Volatility with a Resilient Support System
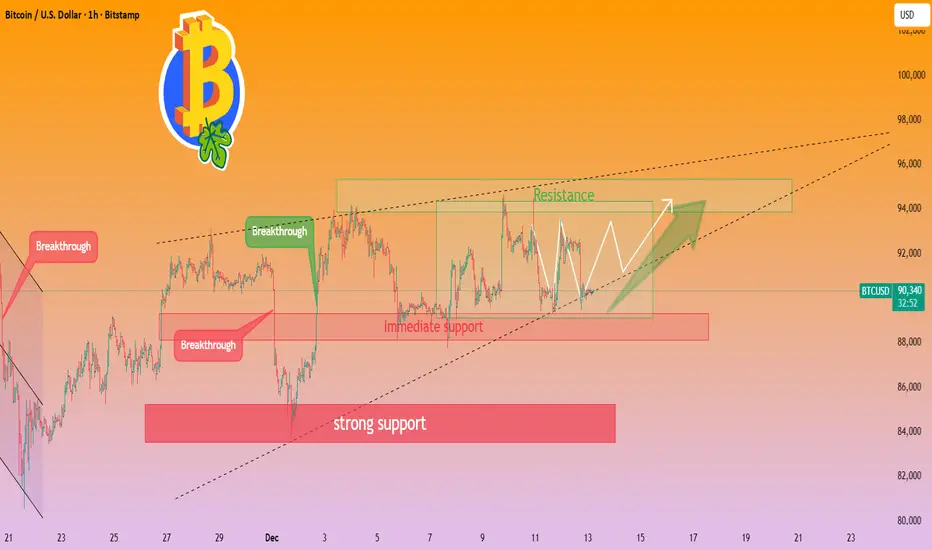
Bitcoin's price of $90,300 is positioned at the midpoint of the trading range of $89,300 - $94,200. At this stage, it has formed a three - fold solid technical support system, laying a solid foundation for a potential breakthrough:
Bollinger Band Lower Track Acts as an Immediate Strong Support: The $89,300 level, which corresponds to the lower track of the Bollinger Band, has withstood multiple rounds of market testing without being broken. This fully indicates that there is sufficient capital accumulation at this price level. Whenever the price approaches this range, it can attract bargain - hunting funds, making it a reliable immediate support for Bitcoin.
Psychological and Capital Support Resonate at the Round Number Level: The $90,000 mark is not only a crucial psychological threshold for investors but also overlaps with the previous intensive trading zone. For most market participants, round - number prices often serve as important reference points for trading decisions. The combination of strong psychological recognition and sufficient capital absorption capacity at this level creates a resonant support effect, effectively preventing the price from plummeting sharply.
Indicator Signals Show Fading Downward Momentum: Although the MACD indicator on the daily chart shows a death cross, a bearish signal, the green bars have been continuously narrowing. This suggests that the short - term downward momentum of Bitcoin is gradually weakening. Meanwhile, the RSI indicator on the 4 - hour chart has moved out of the oversold zone. These indicator changes collectively imply that the market's selling pressure is easing, and the probability of a price breakthrough after a period of consolidation is significantly increasing.
In terms of resistance levels, the key resistance is concentrated near the 0.618 Fibonacci retracement level at $94,200. Once Bitcoin successfully breaks through this resistance with sufficient trading volume, it will open up an upward space towards $96,000. Overall, Bitcoin is currently in a layout window featuring clear support and accessible resistance. For investors, it is a suitable time to formulate trading strategies based on the boundary of the volatility range, with long positions built near the support zones and profit - taking set near the key resistance levels.
Bitcoin trading strategy
buy:89000-90000
tp:92000-93000-95000
sl:88000
The expectation for the Federal Reserve's December rate cut is characterized by "hidden support amid divergences". Although data from the CME FedWatch Tool showed that the probability of a 25BP rate cut dropped to 44.4%, this downward trend has been offset by two key factors. On one hand, Kevin Hassett, a White House official and a front - runner for the next Fed chair, publicly voiced his support for unconventional rate cuts, stating that there is substantial room for sharp interest rate reductions given the current economic data. On the other hand, former President Trump has been exerting constant policy pressure on the Federal Reserve. These two forces combined have prevented the market's expectation for a dovish policy guideline from fading away.
The fundamental support for the Fed's potential easing lies in the weakness of the U.S. economic fundamentals, especially the deteriorating labor market. In November, the ADP employment figure decreased by 32,000, and the number of layoffs soared by 183%. Such obvious signs of a sluggish labor market have provided solid realistic grounds for the Federal Reserve to implement loose monetary policies. It has become a preventive measure for the Fed to cut interest rates to avoid the spillover of the labor market's weakness to consumption and overall economic growth.
Additionally, Bitcoin and the U.S. dollar index maintain a strong negative correlation of -0.72. As the logic of the Fed's easing policy continues to take shape, the U.S. dollar is likely to weaken further. This inherent correlation has reserved sufficient room for Bitcoin's rebound after the dollar weakens. Currently, Bitcoin's price of $90,300 has already partially absorbed the risk of a less - than - expected rate cut. Looking ahead, the repair of the expectation gap, which comes from the possible alignment between the Fed's future policy moves and the market's dovish expectations, will become the core driving force for bullish positions in Bitcoin.
2. Technical Structure: At the End of Range Volatility with a Resilient Support System
Bitcoin's price of $90,300 is positioned at the midpoint of the trading range of $89,300 - $94,200. At this stage, it has formed a three - fold solid technical support system, laying a solid foundation for a potential breakthrough:
Bollinger Band Lower Track Acts as an Immediate Strong Support: The $89,300 level, which corresponds to the lower track of the Bollinger Band, has withstood multiple rounds of market testing without being broken. This fully indicates that there is sufficient capital accumulation at this price level. Whenever the price approaches this range, it can attract bargain - hunting funds, making it a reliable immediate support for Bitcoin.
Psychological and Capital Support Resonate at the Round Number Level: The $90,000 mark is not only a crucial psychological threshold for investors but also overlaps with the previous intensive trading zone. For most market participants, round - number prices often serve as important reference points for trading decisions. The combination of strong psychological recognition and sufficient capital absorption capacity at this level creates a resonant support effect, effectively preventing the price from plummeting sharply.
Indicator Signals Show Fading Downward Momentum: Although the MACD indicator on the daily chart shows a death cross, a bearish signal, the green bars have been continuously narrowing. This suggests that the short - term downward momentum of Bitcoin is gradually weakening. Meanwhile, the RSI indicator on the 4 - hour chart has moved out of the oversold zone. These indicator changes collectively imply that the market's selling pressure is easing, and the probability of a price breakthrough after a period of consolidation is significantly increasing.
In terms of resistance levels, the key resistance is concentrated near the 0.618 Fibonacci retracement level at $94,200. Once Bitcoin successfully breaks through this resistance with sufficient trading volume, it will open up an upward space towards $96,000. Overall, Bitcoin is currently in a layout window featuring clear support and accessible resistance. For investors, it is a suitable time to formulate trading strategies based on the boundary of the volatility range, with long positions built near the support zones and profit - taking set near the key resistance levels.
Bitcoin trading strategy
buy:89000-90000
tp:92000-93000-95000
sl:88000
Trade active
Bitcoin trading strategy
💹💹💹Trading strategies and analysis: Gold, BTC, crude oil, foreign exchange, etc.
📶📶📶Free trading signals:t.me/+EbXVM-CStnFmNjBk
📶📶📶Free trading signals:t.me/+EbXVM-CStnFmNjBk
Disclaimer
The information and publications are not meant to be, and do not constitute, financial, investment, trading, or other types of advice or recommendations supplied or endorsed by TradingView. Read more in the Terms of Use.