Analysis:
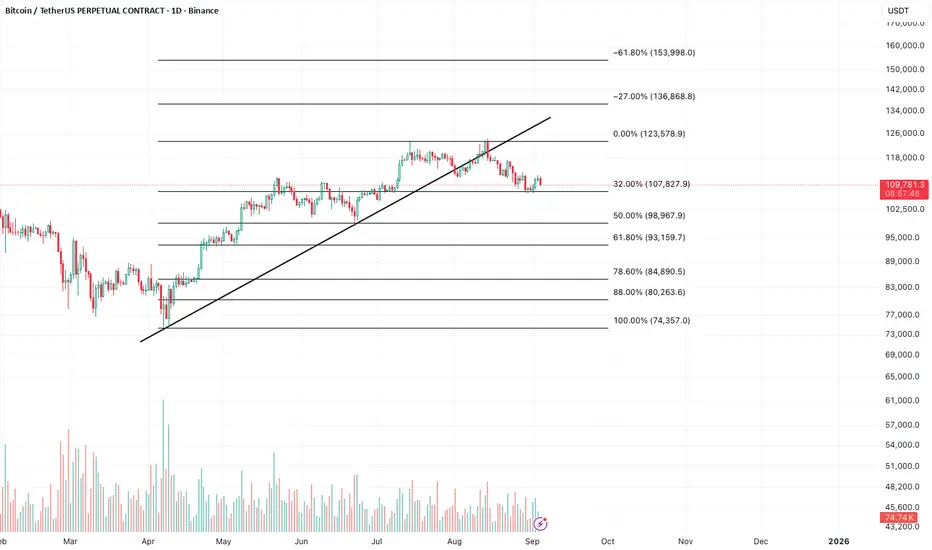
Bitcoin recently broke below its ascending trendline on the daily chart, signaling a potential shift in momentum. After reaching the 0% Fibonacci level near 123,500 USDT, price retraced and is now consolidating around the 32% retracement at 107,800 USDT.
This level is acting as immediate support. A clean break below could open the way toward deeper retracements:
50% retracement at 98,967 USDT
61.8% retracement at 93,159 USDT
On the other hand, if buyers defend the 32% level, Bitcoin may attempt another move upward to retest resistance zones around 123,500 USDT.
Key Levels to Watch:
Support: 107,800 / 98,900 / 93,100 USDT
Resistance: 123,500 USDT
Conclusion:
For now, Bitcoin is at a decision point. Holding above 107,800 keeps the bullish structure alive, while losing this support may confirm a deeper correction toward 99K–93K. Traders should watch volume and daily closes around these Fibonacci levels to confirm the next direction.https://www.tradingview.com/chart/WyS4mTUN/
Disclaimer
The information and publications are not meant to be, and do not constitute, financial, investment, trading, or other types of advice or recommendations supplied or endorsed by TradingView. Read more in the Terms of Use.
Disclaimer
The information and publications are not meant to be, and do not constitute, financial, investment, trading, or other types of advice or recommendations supplied or endorsed by TradingView. Read more in the Terms of Use.