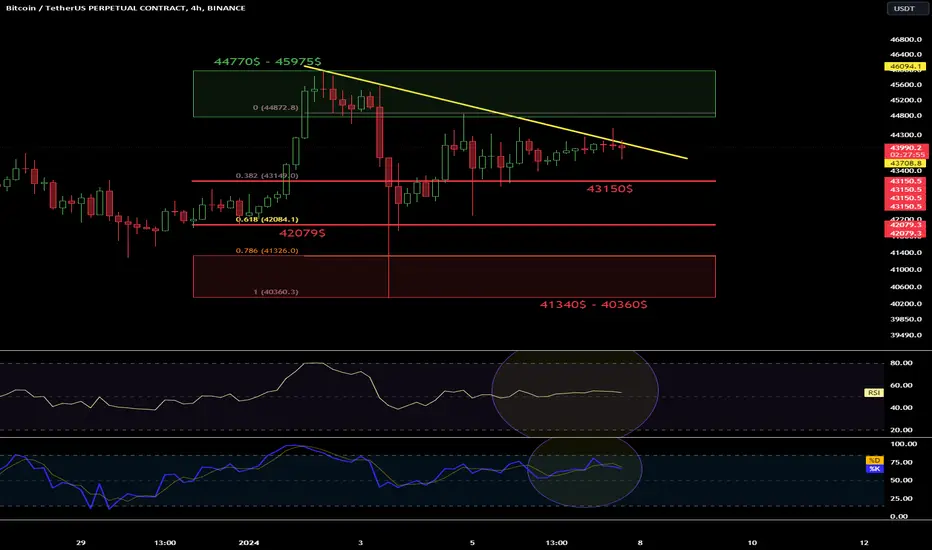
Hello everyone, let's take a look at the BTC to USDT chart on a 4-hour time frame. As you can see, the price is fighting against the local downtrend line.
However, when we unfold the fib retracement grid, we can see that the price is being rejected by a strong resistance zone from $44,770 to $45,957, which is keeping the price from moving towards $48,000.
Looking the other way, there is support at $43,150, second at $42,079, and then a strong support zone from $41,340 to $40,360.
On the RSI indicator, we are moving in the upper part of the range, while the STOCH indicator is in the upper part at the upper limit, which may translate into a price drop.
Disclaimer
The information and publications are not meant to be, and do not constitute, financial, investment, trading, or other types of advice or recommendations supplied or endorsed by TradingView. Read more in the Terms of Use.
Disclaimer
The information and publications are not meant to be, and do not constitute, financial, investment, trading, or other types of advice or recommendations supplied or endorsed by TradingView. Read more in the Terms of Use.