How to Read Candlestick Charts: The Complete Beginner’s Guide 1
What is a Japanese Candlestick?
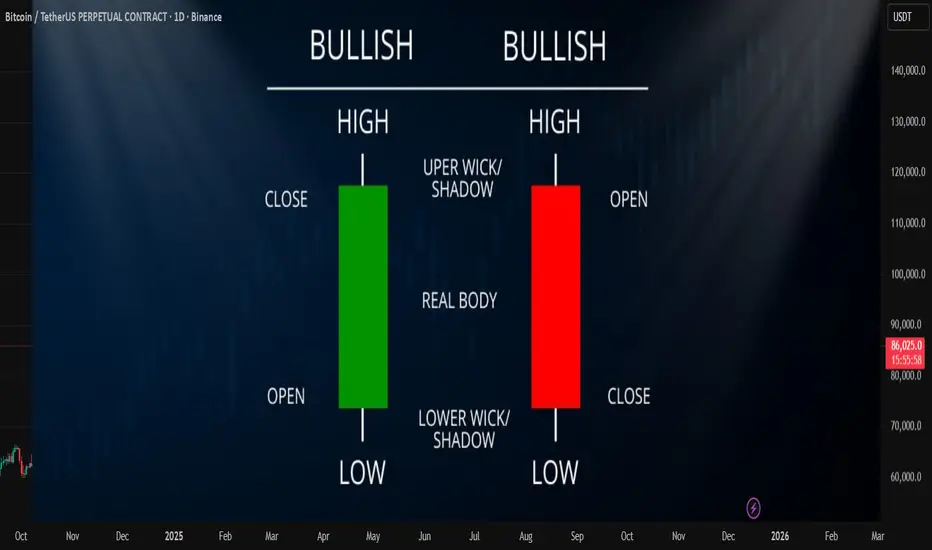
Before you can trade patterns, you must understand the "DNA" of a single candlestick. Unlike a
simple line chart that only shows the closing price, a Japanese candlestick tells you the
complete story of price action over a specific time period using four data points:
1. Open: The opening price.
2. High: The highest price reached during the period.
3. Low: The lowest price reached during the period.
4. Close: The closing price.
How to Read the "Body" and "Wicks"
● Bullish Candle: The Open is BELOW the Close. This means buyers won the session.
● Bearish Candle: The Open is ABOVE the Close. This means sellers won the session.
● The Wicks (Shadows): The thin lines above and below the body represent the extreme
high and low prices, showing price rejection.
The Top 5 Bullish Reversal Patterns
A bullish reversal pattern signifies that buyers are momentarily taking control, usually forming
after a price decline.
1. The Hammer The Hammer is a 1-candle pattern that signifies rejection of lower prices.
● Recognition: Little to no upper shadow. The lower shadow is about 2–3 times the length
of the body.
● Meaning: Sellers pushed price down at the open, but huge buying pressure stepped in
to close the price near the highs.

2. Bullish Engulfing Pattern A 2-candle pattern where buyers completely overwhelm sellers.
● Recognition: The first candle is bearish. The second candle is bullish and its body
completely "covers" (engulfs) the body of the first candle.
● Meaning: Buyers have won the battle emphatically.

3. Piercing Pattern Similar to the Engulfing pattern but slightly weaker.
● Recognition: The second bullish candle closes above the 50% mark (halfway point) of
the previous bearish candle.

4. Tweezer Bottom A 2-candle pattern indicating the market is struggling to trade lower.
● Recognition: The first candle shows rejection of lower prices. The second candle
re-tests that exact low and closes higher.

5. Morning Star A powerful 3-candle reversal pattern.
● Recognition:
1. A long bearish candle.
2. A small-bodied candle (indecision).
3. A strong bullish candle closing more than 50% into the first candle's body.
● Meaning: Sellers are exhausted, and buyers have taken control.

Next lesson will be posted on next week
stay connected
-TuffyCalls (Team Mubite)
Before you can trade patterns, you must understand the "DNA" of a single candlestick. Unlike a
simple line chart that only shows the closing price, a Japanese candlestick tells you the
complete story of price action over a specific time period using four data points:
1. Open: The opening price.
2. High: The highest price reached during the period.
3. Low: The lowest price reached during the period.
4. Close: The closing price.
How to Read the "Body" and "Wicks"
● Bullish Candle: The Open is BELOW the Close. This means buyers won the session.
● Bearish Candle: The Open is ABOVE the Close. This means sellers won the session.
● The Wicks (Shadows): The thin lines above and below the body represent the extreme
high and low prices, showing price rejection.
The Top 5 Bullish Reversal Patterns
A bullish reversal pattern signifies that buyers are momentarily taking control, usually forming
after a price decline.
1. The Hammer The Hammer is a 1-candle pattern that signifies rejection of lower prices.
● Recognition: Little to no upper shadow. The lower shadow is about 2–3 times the length
of the body.
● Meaning: Sellers pushed price down at the open, but huge buying pressure stepped in
to close the price near the highs.
2. Bullish Engulfing Pattern A 2-candle pattern where buyers completely overwhelm sellers.
● Recognition: The first candle is bearish. The second candle is bullish and its body
completely "covers" (engulfs) the body of the first candle.
● Meaning: Buyers have won the battle emphatically.
3. Piercing Pattern Similar to the Engulfing pattern but slightly weaker.
● Recognition: The second bullish candle closes above the 50% mark (halfway point) of
the previous bearish candle.
4. Tweezer Bottom A 2-candle pattern indicating the market is struggling to trade lower.
● Recognition: The first candle shows rejection of lower prices. The second candle
re-tests that exact low and closes higher.
5. Morning Star A powerful 3-candle reversal pattern.
● Recognition:
1. A long bearish candle.
2. A small-bodied candle (indecision).
3. A strong bullish candle closing more than 50% into the first candle's body.
● Meaning: Sellers are exhausted, and buyers have taken control.
Next lesson will be posted on next week
stay connected
-TuffyCalls (Team Mubite)
Mubite | Crypto Prop Firm
Website: mubite.com
Discord: discord.gg/mubite
Twitter: x.com/mubite_com
Instagram: instagram.com/mubite_official
Youtube: youtube.com/@mubite_official
Website: mubite.com
Discord: discord.gg/mubite
Twitter: x.com/mubite_com
Instagram: instagram.com/mubite_official
Youtube: youtube.com/@mubite_official
Disclaimer
The information and publications are not meant to be, and do not constitute, financial, investment, trading, or other types of advice or recommendations supplied or endorsed by TradingView. Read more in the Terms of Use.